42
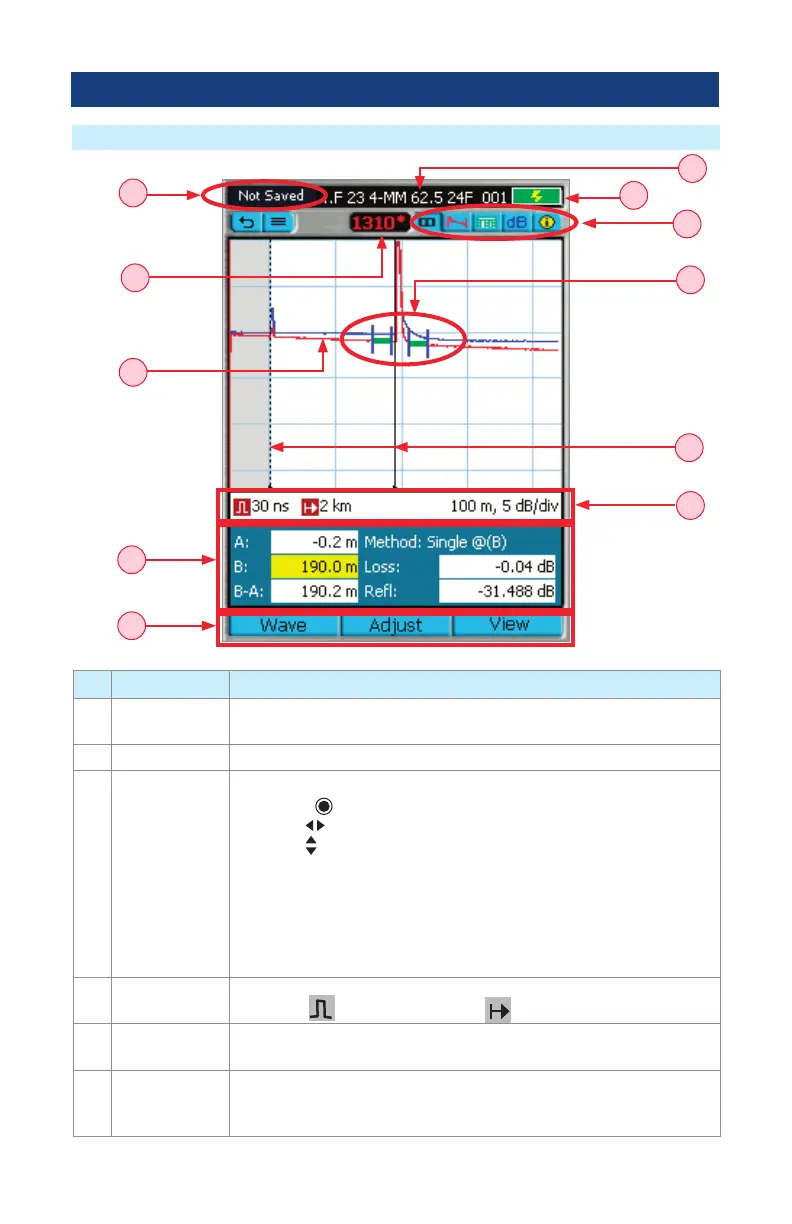
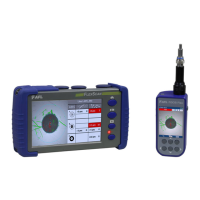
Trace Viewer Features
OTDR Test Results Viewer
Ref Feature Description
1 Trace This is a graph of insertion loss vs. distance. The vertical axis shows loss
in dB. The horizontal axis shows distance in user-selected distance units.
2 LSA adjust lines Available for LSA Loss Methods, not Two Point measurements.
3 Cursors Used to measure loss and distance.
• Press the
key to toggle between the A and B cursors.
• Use the
arrows to move the active cursor left/right.
• Use the
arrows to jump the active cursor to the next or previous
event location.
• When cursors cross, the left cursor will become A and the right cursor
will become B.
• Zooming is centered around the active cursor.
• The active cursor is shown as a solid line.
• The inactive cursor is shown as a dashed line.
4 Test settings
data eld
This eld displays various test settings data as follows: distance • dB per
division •
pulse width setting • Range value.
5 Soft function
key labels
Soft function keys are located on the front panel. The label shown on the
display above each key indicates the current use of each function key.
6 Test results
eld
This eld displays various test results as follows: Loss Method, A and
B cursor location, distance from A to B in user-selected distance units,
measured loss and reectance, and event data.
2
3
4
6
5
11
10
9
8
1
7