57
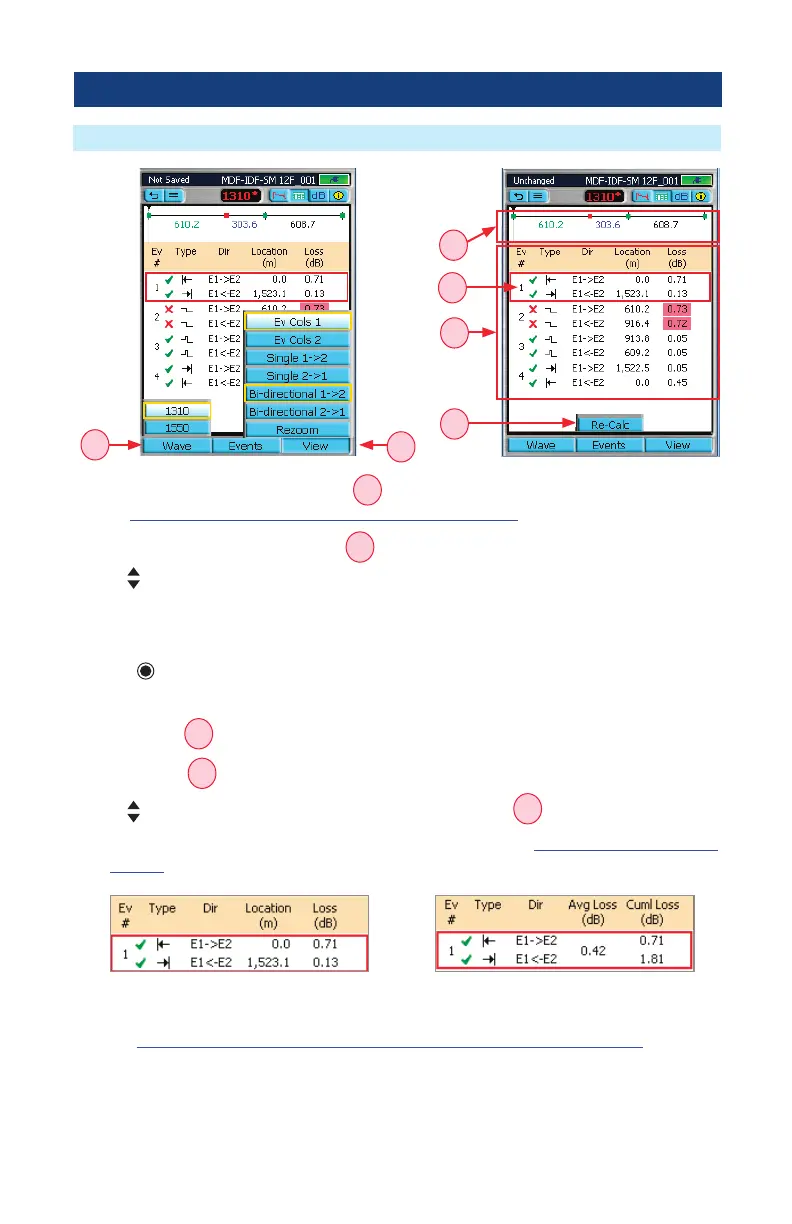
View Results in Event Table: Bi-directional View
Bi-directional Analysis Operation
A
B
1. Press Wave to display the Wave menu
A
and select the desired wavelength to be displayed
(see “Wavelength Selection Menu In OTDR Pages” on page 45 for details).
2. Press View to display the View menu
B
.
3. Use arrows to select the desired option:
– Bi-directional 1 -> 2 to display the Event Table and Event Map taken from End 1.
– Bi-directional 2 -> 1 to display the Event Table and Event Map taken from End 2.
4. Press key to conrm selection and exit View menu.
5. The Event Table page will display test results for the selected bi-directional test as follows:
– Event Map
C
.
– Event Table
D
.
6. Use
arrows to highlight the desired event in the Event Table
E
.
– See test data shown from both Ends. For Event Icons legend, see “Event Icons and Types” on
page 48.
or
– If needed, switch between two column sets views, Ev Cols 1 and Ev Cols 2, to see the
complete analysis for the selected bi-directional test.
See “How to Switch Column Sets in Event Table (Bi-directional View)” on page 58 for
details.
C
D
E
F