55
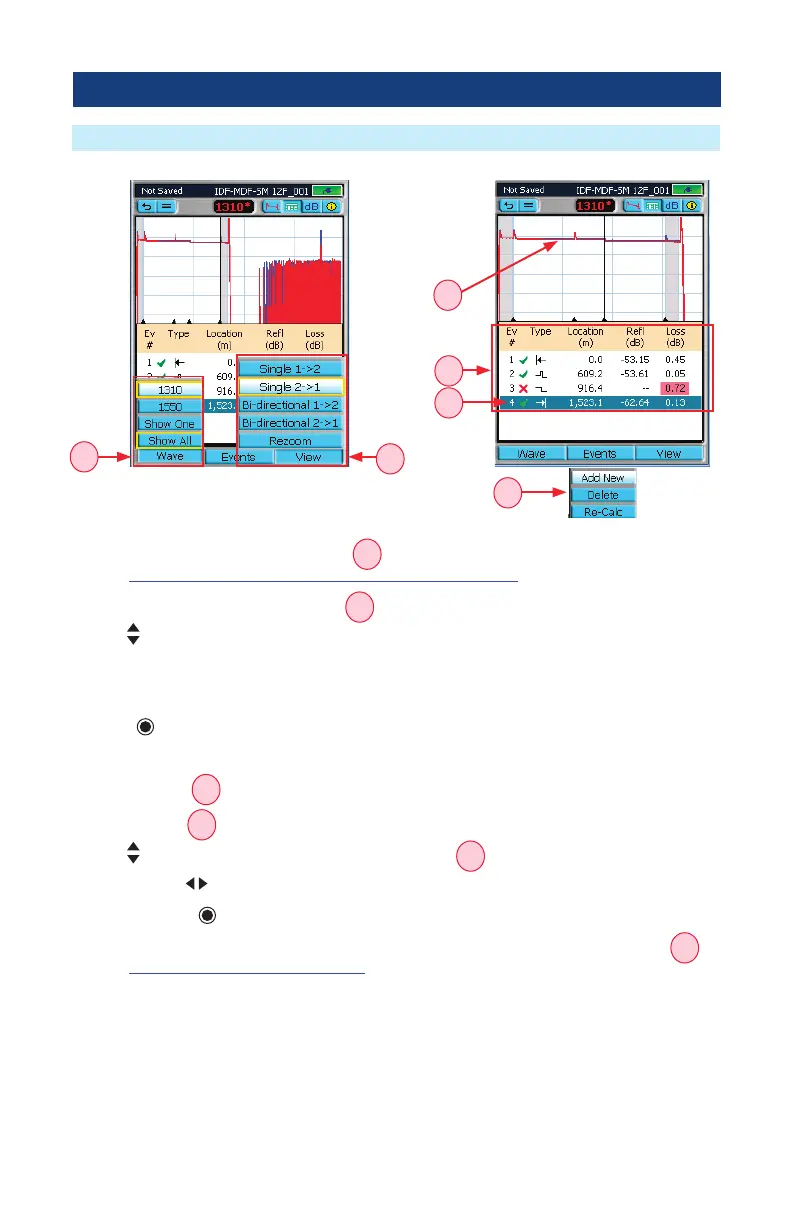
View Results in Event Table: Single Direction View
Bi-directional Analysis Operation
A
B
C
D
E
F
1. Press Wave to display the Wave menu
A
and select the desired wavelength to be displayed
(see “Wavelength Selection Menu In OTDR Pages” on page 45 for details).
2. Press View to display the View menu
B
.
3. Use arrows to select the desired option:
– Single 1 -> 2 to display the Event Table and Trace taken from End 1.
– Single 2 -> 1 to display the Event Table and Trace taken from End 2.
4. Press
key to conrm selection and exit View menu.
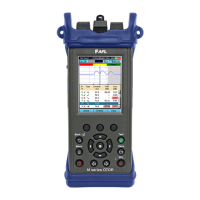
5. The Event Table page will display test results for the selected single direction test as follows:
– Trace Graph
C
– Event Table
D
6. Use
arrows to highlight an event in the Event Table
E
.
7. You may use arrows to zoom in horizontally around the active cursor.
8. You may press key to zoom in and measure the selected event on the Trace page.
9. If needed, Display the Events menu that allows to add, delete, and re-calculate events
F
(see “Re-Calculate Events” on page 48 for details).