47
Event Table and Summary Results are generated together.
To generate the Event Table and Summary Results, set Mode to Full Auto or set Mode to Expert and
Events (Event Settings) to Auto.
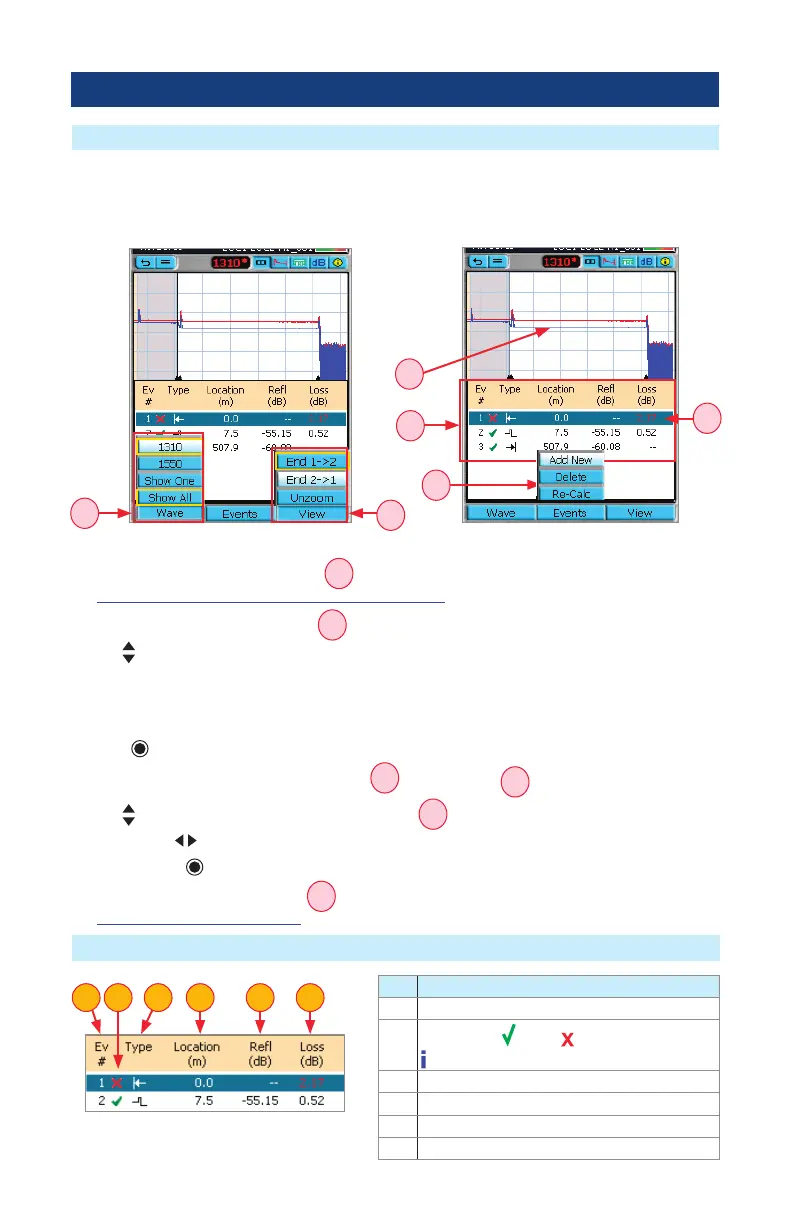
View Results in Event Table
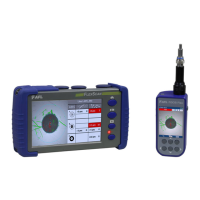
OTDR Test Results Viewer
A
B
C
D
E
F
To View test results in the Event Table:
1. Press Wave to display the Wave menu
A
and select the desired wavelength to be displayed (see
“Wavelength Selection Menu In OTDR Pages” on page 45 for details).
2. Press View to display the View menu
B
.
3. Use
arrows to select the desired option (Available when the ber has been tested in both directions. If
the ber has only been tested in one direction one option will be shown greyed out.):
– End 1 -> 2 to display the trace taken from End 1.
– End 2 -> 1 to display the trace taken from End 2.
4. Press key to conrm selection and exit View menu.
5. The Event Table page will display Trace Graph
C
and Event Table
D
for the selected test.
6. Use
arrows to highlight an event in the Event Table
E
.
7. You may use arrows to zoom in horizontally around the active cursor.
8. You may press key to zoom in and measure the selected event on the Trace page.
9. If needed, display the Events menu
F
that allows users to add, delete, and re-calculate events. See
“Re-Calculate Events” on page 48 for details.
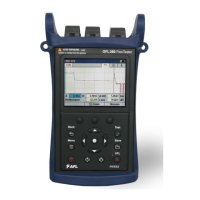
Event Table Data
Ref. Description
1 Event Number
2
Status eld:
- Pass, - Fail,
- Information only
3 Event Type
4 Event Location
5 Reectance (dB)
6 Loss (dB)
1 2 3 4 5 6