Chapter 7 Analyzing, Transferring, and Printing Measurement Data
Displaying the Analyze Data Screen
Getting Started Guide 7-3
7
Displaying the Analyze Data Screen
To begin data analysis, select Analyze Data on the Collect Data screen.
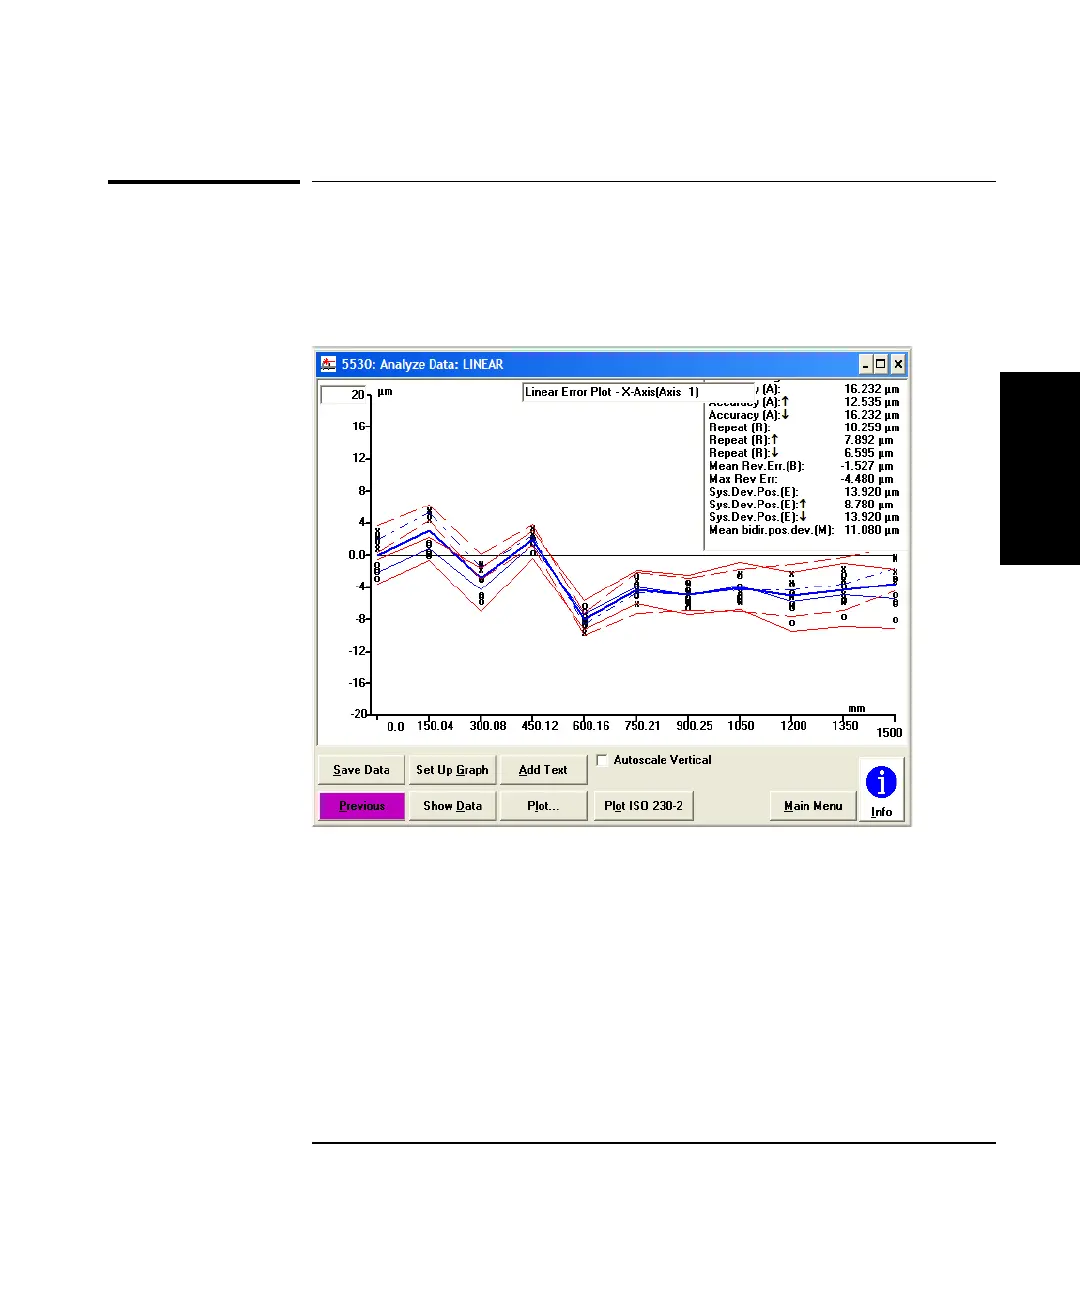
The Analyze Data screen is displayed (Figure 7-1).
Figure 7-1. Analyze Data: LINEAR screen
The Analyze Data screen presents graphical data and numerical analysis
of the data set. Use the Set Up Graph screen (by selecting the Set Up
Graph button) to specify:
• what numerical analysis is to be performed on the data
• what analysis is to be plotted on the graph shown on the Analyze Data
screen
On the Analyze Data graph, the horizontal axis represents machine
position; the vertical axis represents measured error.
 Loading...