Chapter 7 Analyzing, Transferring, and Printing Measurement Data
Setting Up the Data Analysis Graph
Getting Started Guide 7-9
7
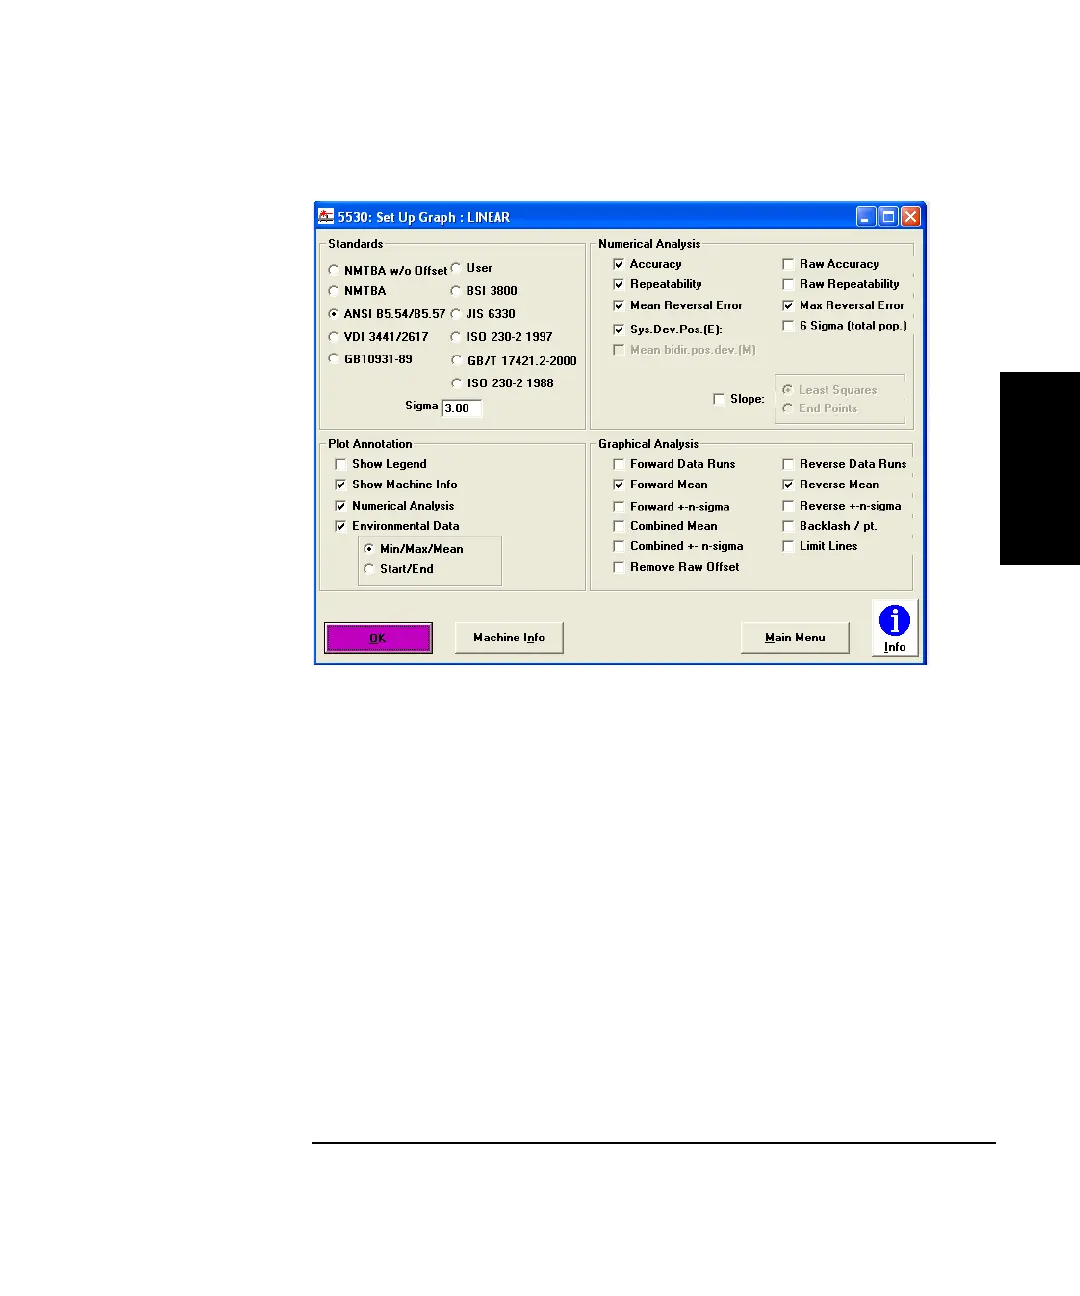
Figure 7-4. Set Up Graph: LINEAR screen
Selecting an industry standard
The industry standard you select on the Set Up Graph screen determines
the settings for numerical and graphical analyses. If you alter any of the
settings dictated by the industry standard selected, when you select OK
and return to the Analyze Data screen the comment box will show the
standard, followed by “(modified),” along with the results of the numerical
analysis.
The numerical analysis figures present a single calculated value for all
data points in the measurement. The graphical analysis enables you to
view the data as an array of individual values so you can analyze trends
within the data.
 Loading...