12-24 Service Guide
Theory of Operation 8719ET/20ET/22ET
Receiver Theory 8719ES/20ES/22ES
RF Network Analyzers
Receiver Theory
The receiver measures and processes the input signals into digital information for display.
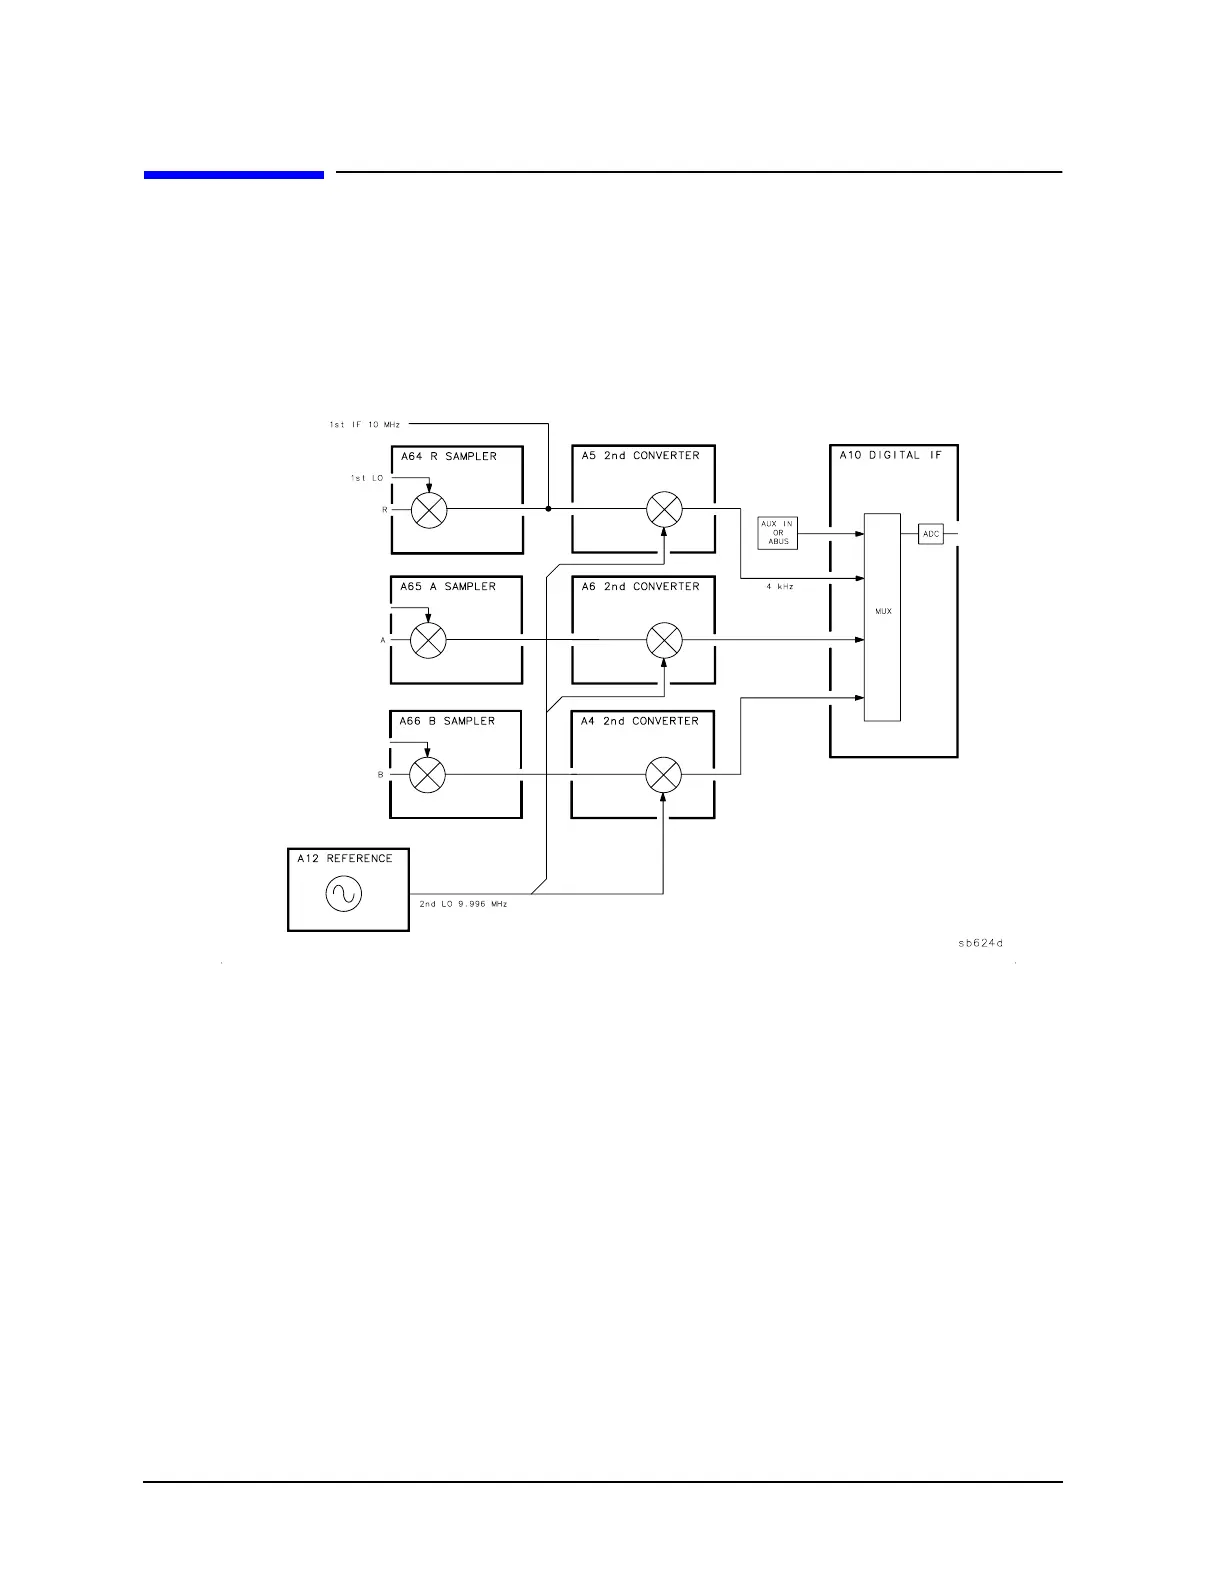
Figure 12-8 is a simplified block diagram of the receiver functional group. The A12
reference assembly, which is part of the source group, is also included in the illustration to
show how the 2nd LO signal is derived.
Figure 12-8 Receiver Functional Group Simplified Block Diagram
Samplers and Second Converters
Each input signal goes to a sampler and then to the second converter assembly (R, A, and
B) that down-converts the signal to a fixed 4 kHz 2nd IF.
The 1st LO signal is a comb of harmonics of the synthesizer signal, produced by a step
recovery diode in the A52 pulse generator. Refer to “Source Group Theory” on page 12-13
for details.
A64/A65/A66 (A67 Option 400) Samplers. The signal from the source is mixed with the
1st LO harmonics in the samplers. One of the harmonic signals is 10 MHz above the
desired frequency. The mixing products are filtered, leaving only the difference between
that harmonic and the source frequency. This fixed 10 MHz signal (1st IF) is calculated as
follows:
F
IF
= N x F
VCO
− F
S
(where N is the harmonic number)
 Loading...