Service Guide 2-31
8719ET/20ET/22ET System Verification and Performance Tests
8719ES/20ES/22ES System Verification
RF Network Analyzers
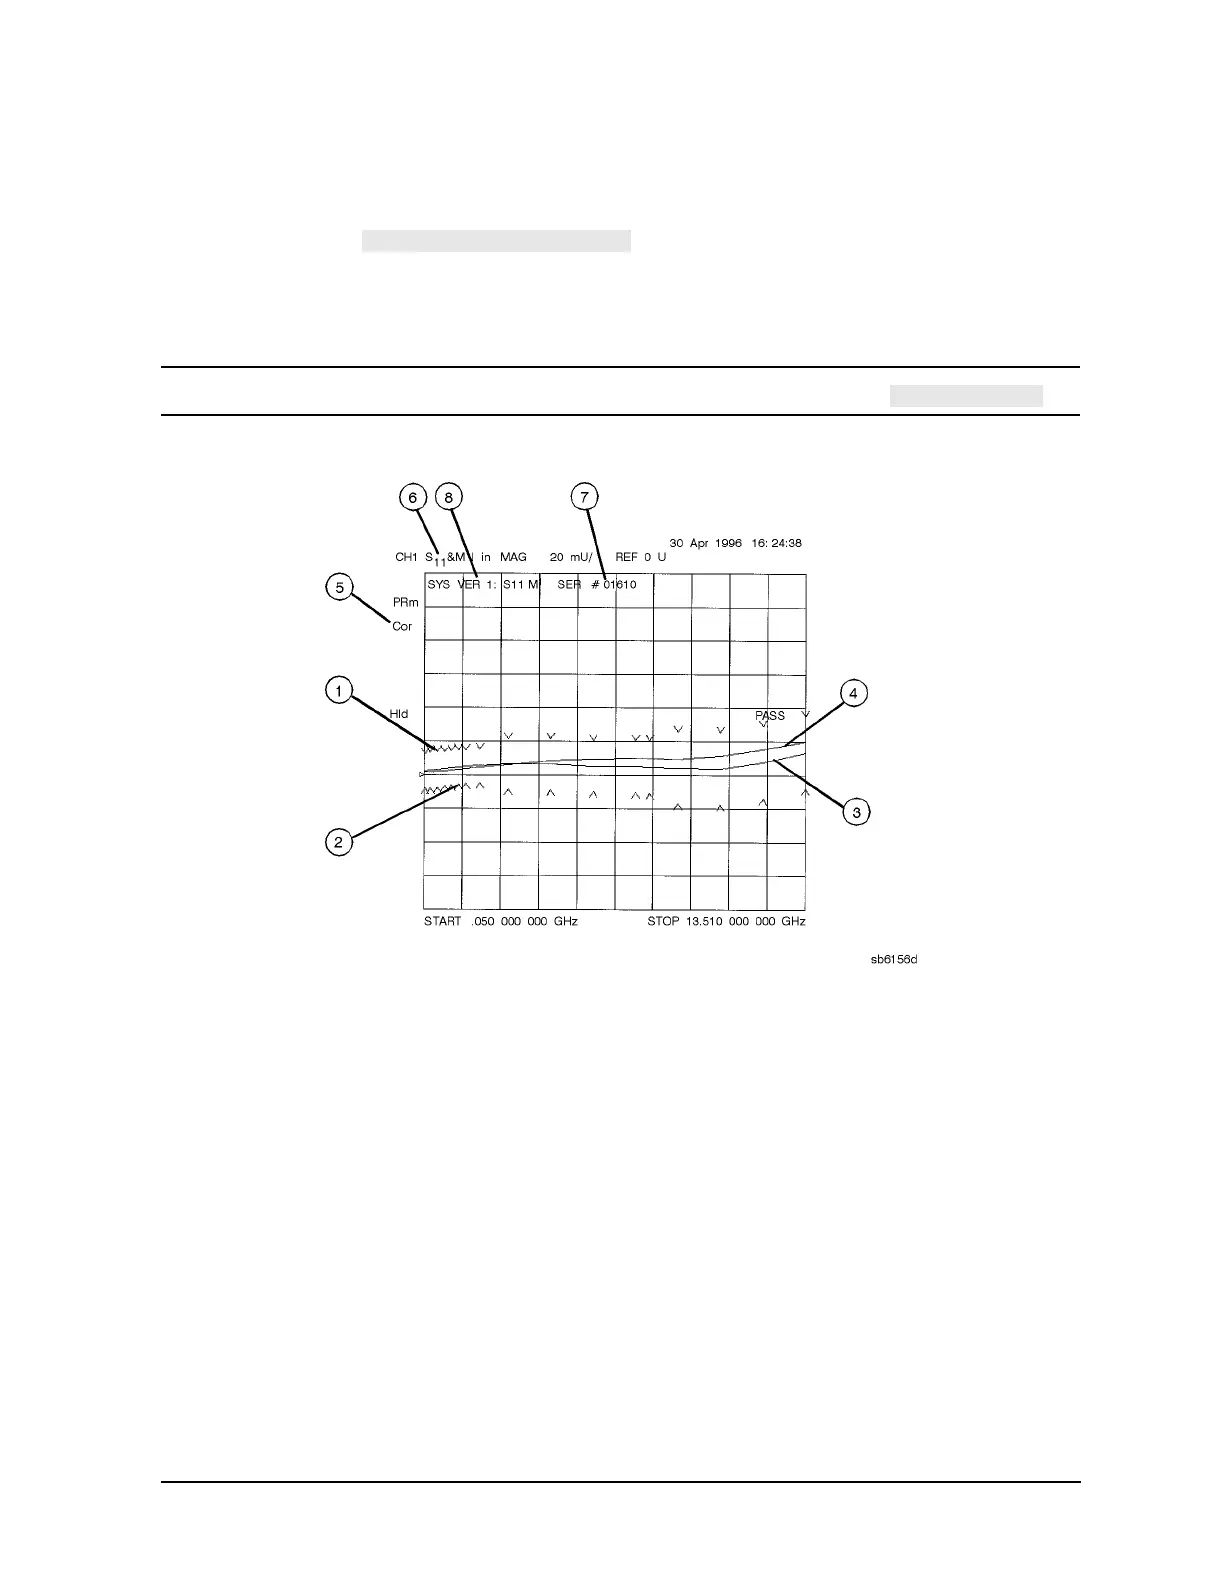
Interpreting the Verification Results
Figure 2-15 and Figure 2-16 show examples of typical verification results, with dump
graphics activated ( ).These printouts include a comparison of
the data from your measurement results with the traceable data and corresponding
uncertainty specifications. Use these printouts to determine whether your measured data
falls within the total uncertainty limits at all frequencies.
NOTE If you only want a tabular list (as in Figure 2-16), activate .
Figure 2-15 Printout of Graphical Verification Results
The callouts in Figure 2-15 are defined as:
1. Upper limit points as defined by the total system uncertainty specifications.
2. Lower limit points as defined by the total system uncertainty specifications.
3. Data measured at the factory.
4. Results of measurement.
5. Correction is turned on.
6. Measurement parameter (S11 and memory, displayed in linear magnitude).
7. Serial number of device (01610).
8. Device being measured (SYS VER 1).
 Loading...