EasyManuals Logo

Agilent Technologies u8903a User Manual

Agilent Technologies u8903a
171 pages
To Next Page IconTo Next Page
To Previous Page IconTo Previous Page
Page #128 background imageLoading...
Page #128 background image
106 U8903A User’s Guide
6 Frequency and Time Domain Analysis
Frequency Domain and Time Domain
The U8903A graph mode displays a 2- dimensional graph of
the signal in the frequency or time domain.
To access the frequency or time domain mode, press
or on the Mode panel respectively.
The settings available in both the frequency and time
domain modes are as follows.
Monitor settings
Input settings
Axis settings
To generate the graph once you have configured the settings,
press on the U8903A front panel.
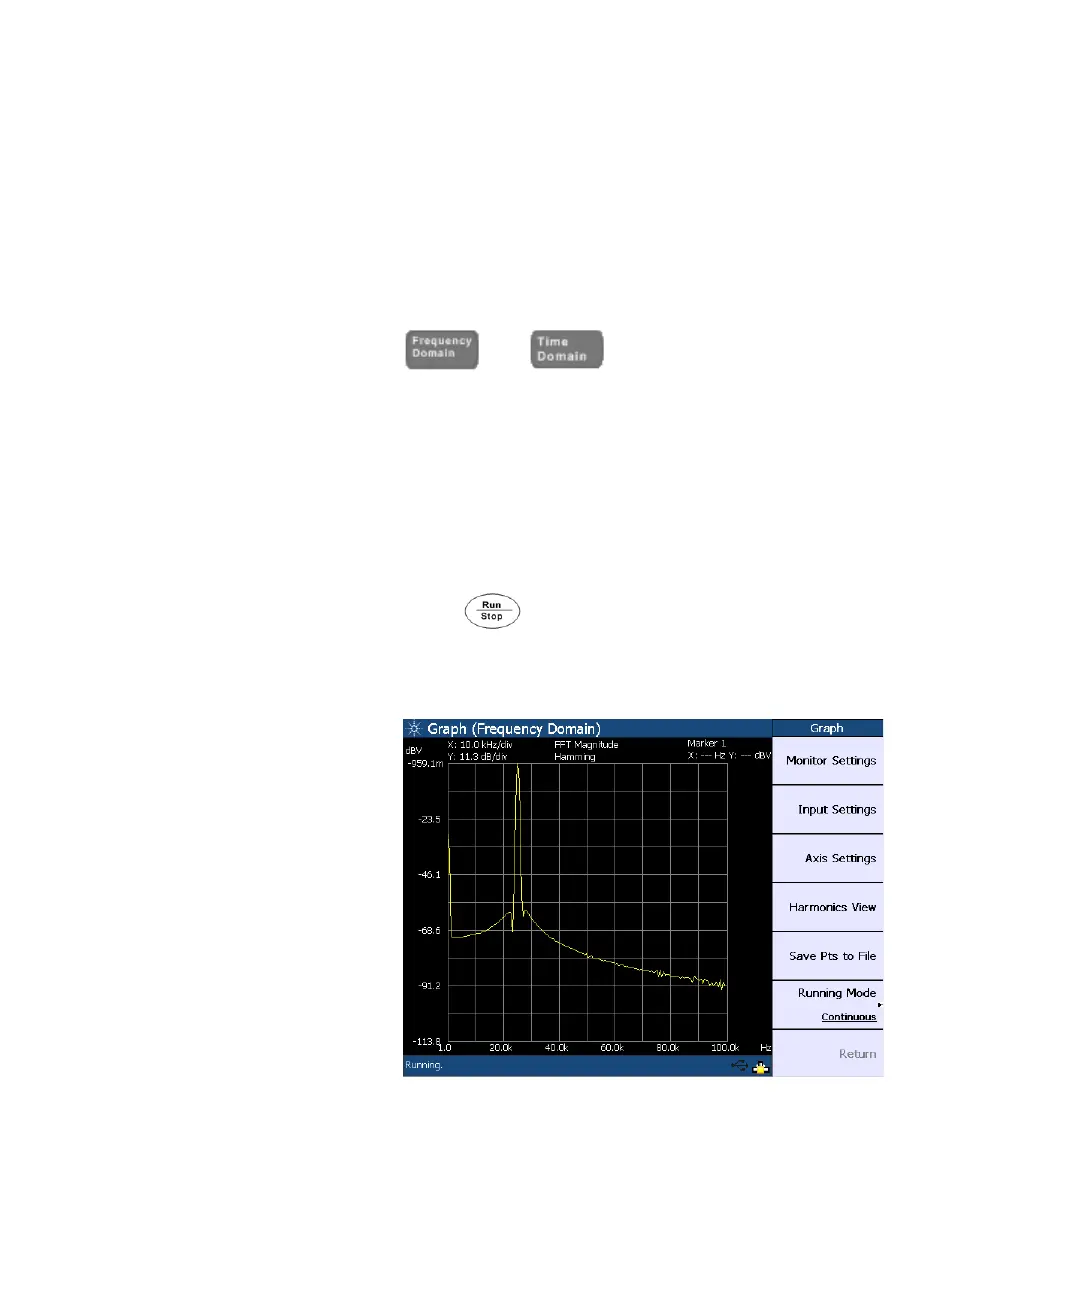
The frequency domain mode is shown in the following figure.
Figure 6-1 Frequency domain mode

Table of Contents

Other manuals for Agilent Technologies u8903a

Questions and Answers:

Question and Answer IconNeed help?

Do you have a question about the Agilent Technologies u8903a and is the answer not in the manual?

Agilent Technologies u8903a Specifications

General IconGeneral
BrandAgilent Technologies
Modelu8903a
CategoryMeasuring Instruments
LanguageEnglish

Related product manuals