Frequency and Time Domain Analysis 6
U8903A User’s Guide 113
Graph Functions
This section describes the commonly used graph functions
which allow you to perform peak searching, configure the
markers, select the marker position on the graph, or
maximize the graph view to the full display size by pressing
the corresponding key on the Graph panel.
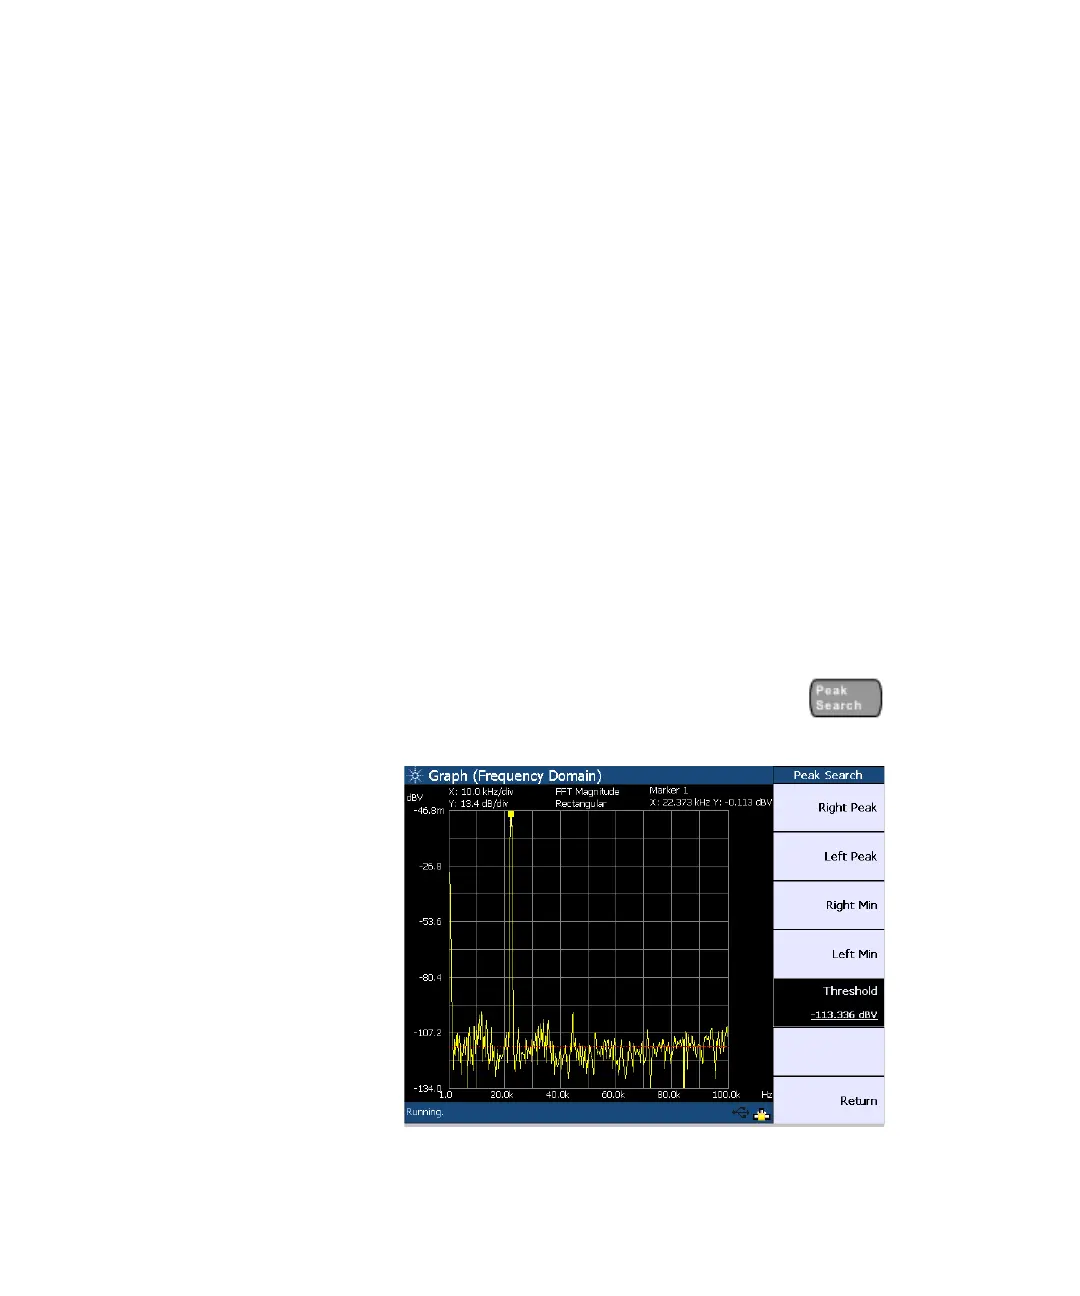
Peak search
This function enables you to place a marker on the peak or
minimum of the graph. You can set the threshold level that
the marker can identify as a peak or minimum on the graph.
If the trace is above the threshold level, it will be identified
as a peak, whereas the trace below the threshold level will
be identified as a minimum. Use the knob on the U8903A
front panel to move the threshold level along the plot. The
X- axis and Y- axis values of the marker will be displayed at
the top right of the graph when you place a marker at either
the right or left peak, or right or left minimum of the graph.
To access the peak search function, press on the
Graph panel. The Peak Search menu is shown as follows.
Figure 6-7 Peak Search menu

 Loading...
