260-668080-001 Rev 002 March 2013 89
Eclipse Edge User Manual
A resolution option provides selection of 15-minute or 24-hour options. 15-minute
provides viewing of seven days worth of 15 minute data bins; 24-hour provides one
months worth of 1 day data bins.
• The graph screen provides a histogram of 15 minute or daily (24 hour) data bins of
RSL, G.826 statistics, event detected, and configuration changes.
• The report screen enables selection of summary data for a selected period (min, max
and mean). It also supports an event listing for the selected period.
Tooltips provide information on screen options and function.
Both 15-minute and one-day data bins are captured from power-on.
History data is held on a FIFO basis. Data in excess of the 15 minute
or daily bin maximums is deleted in favor of new-in data.
The history screen has a 1.5 second sampling rate for RSL capture.
Events of less than this duration may not be presented.
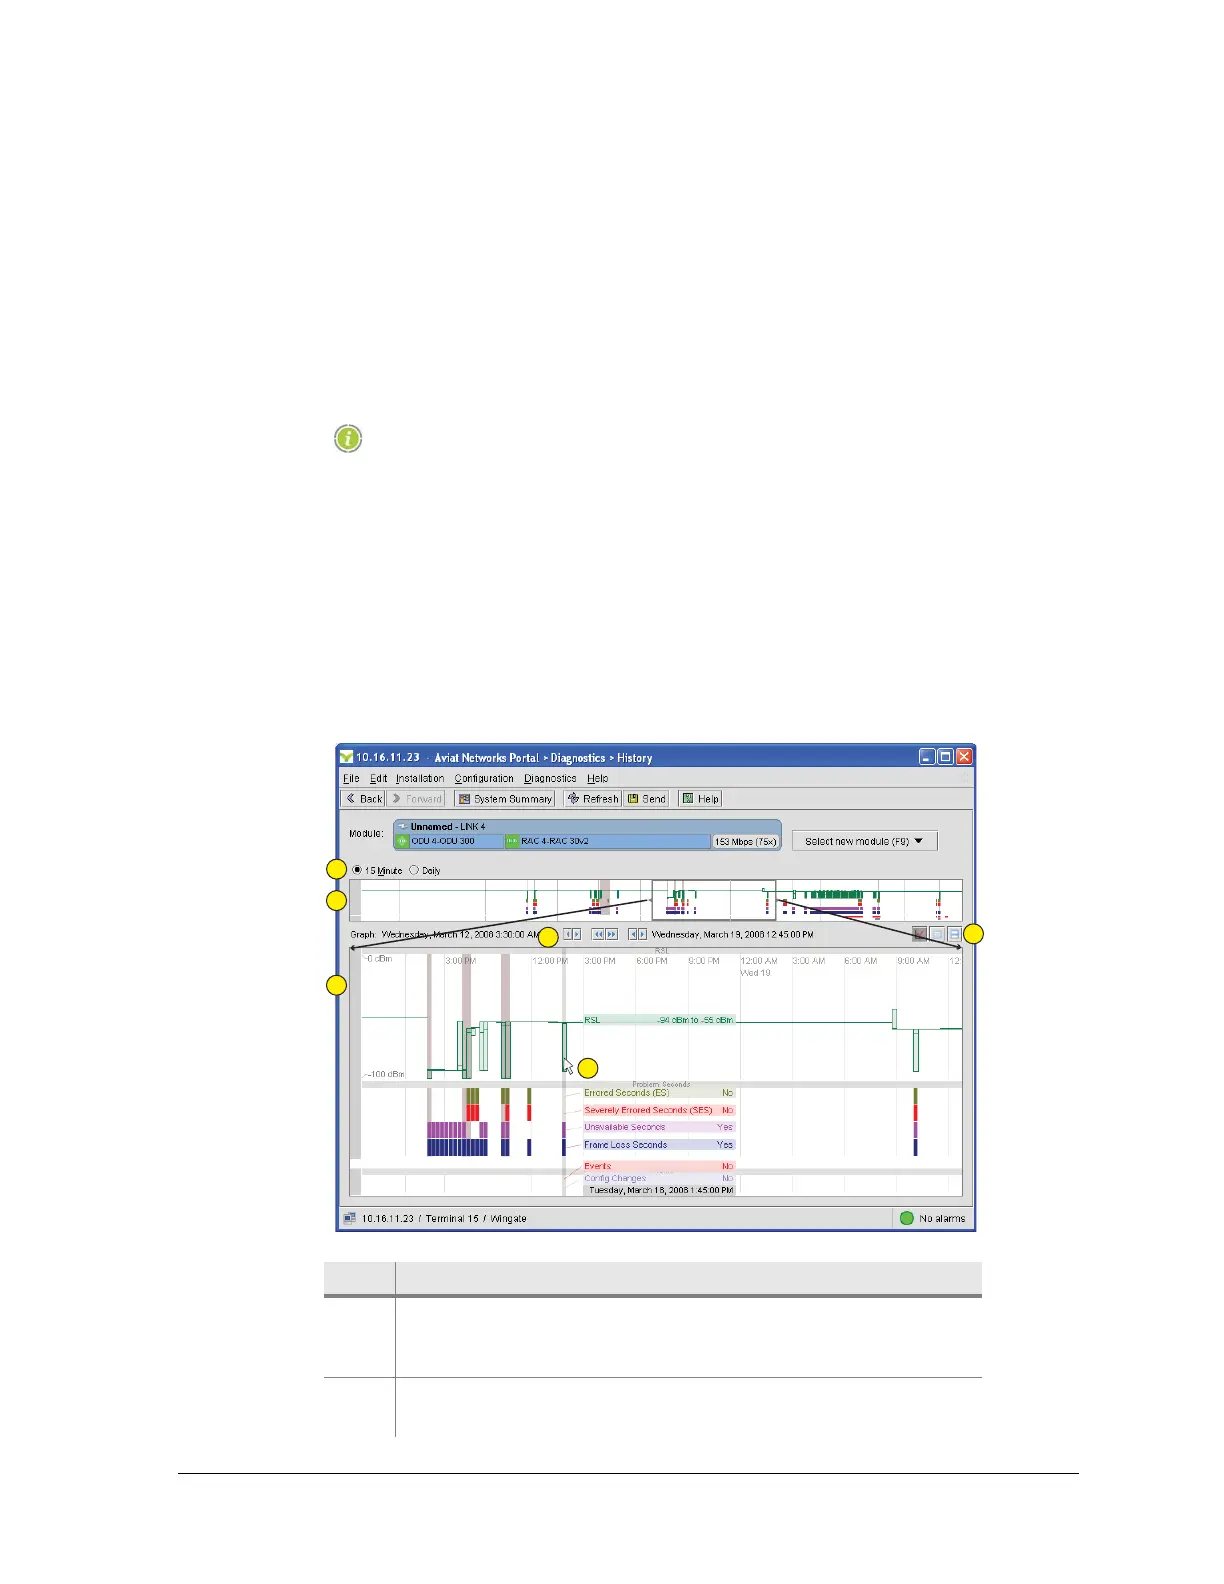
The Graph Screen, as shown in Figure 4-28, provides a link-based view of
operational status. For a protected link, the path data (RSL and G.826) is duplicated.
Figure 4-28. History Graph Screen
Item Description
1 Select a resolution type, 15-minute or Daily. 15 minute is the
default, and is shown in the example screen. Both 15 minute
and daily data bins are captured from power-on.
2 Complete History view. Up to one weeks worth or 15 minute
bins, or one month of daily bins.