90 Aviat Networks
Chapter4. Eclipse Edge Configuration and Diagnostics
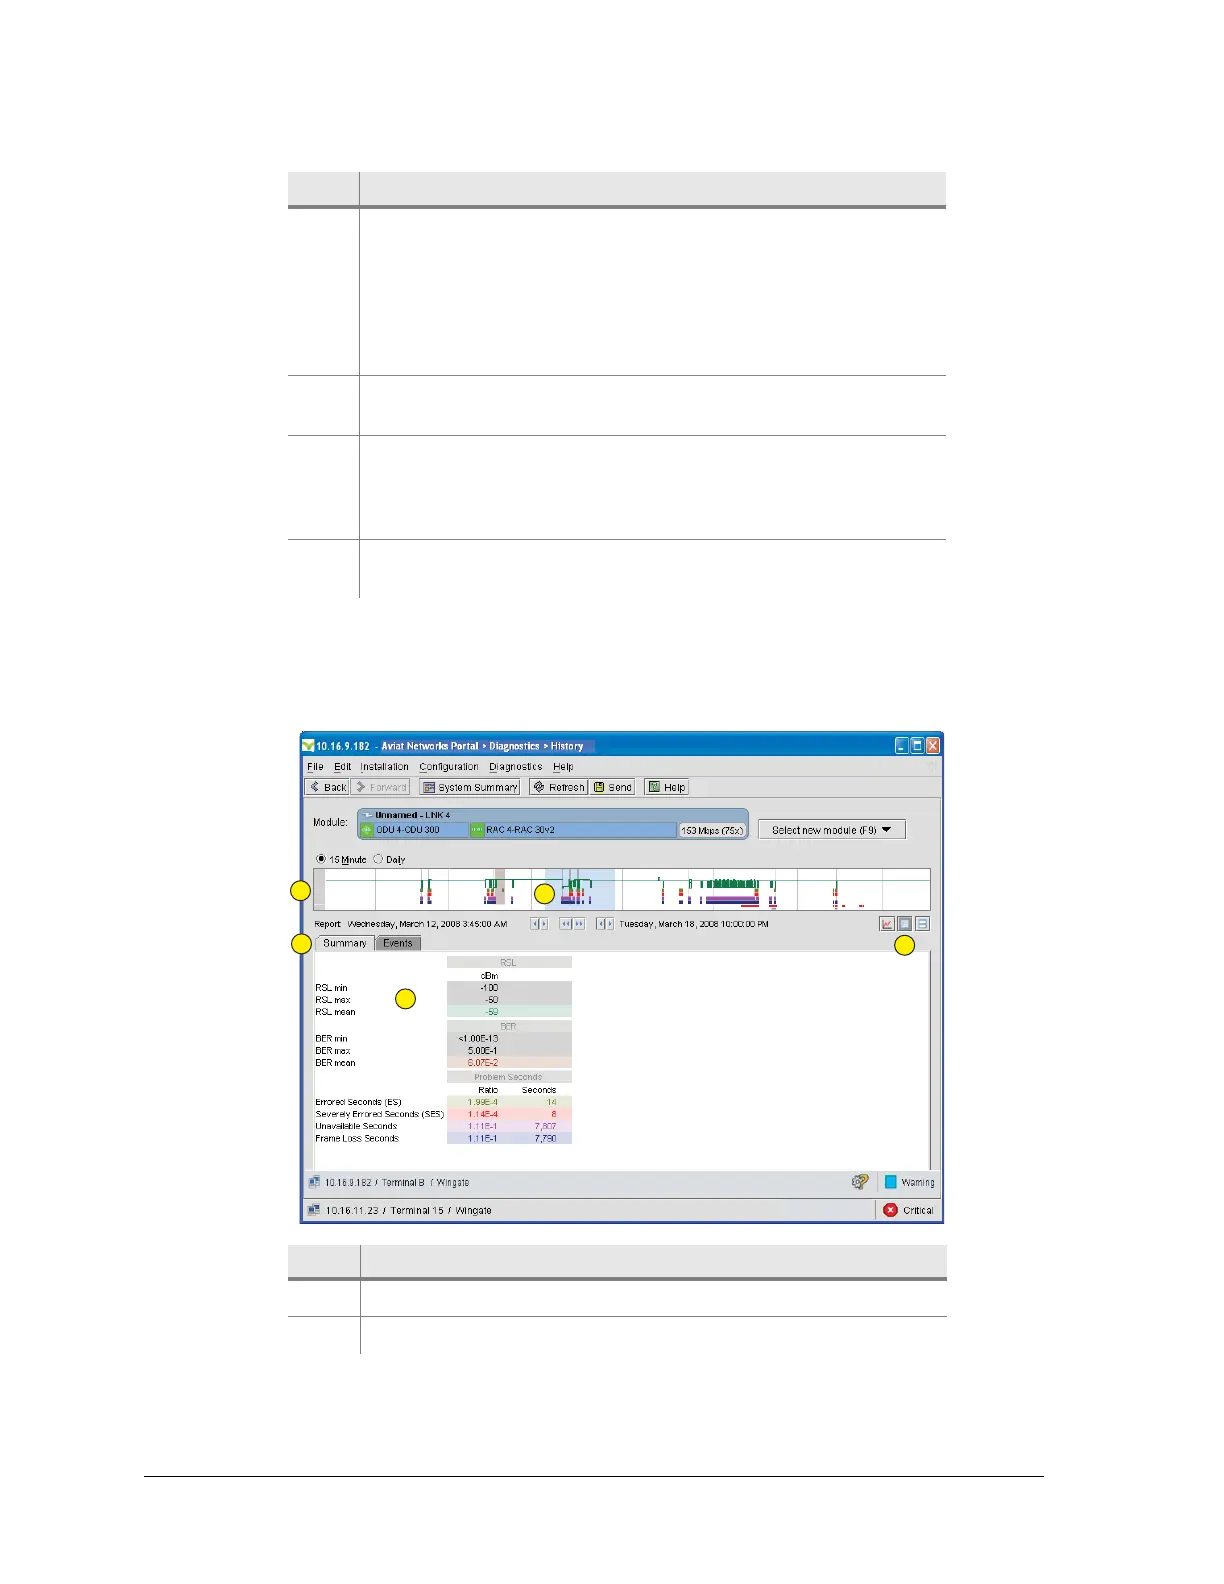
The Report screen, as shown in Figure 4-29, provides a summary view of
operational status for a selected period. For a protected link, the path data (RSL and
G.826) is duplicated.
Figure 4-29. History Report Screen
3 Set the range for the expanded view (4). Either left-click within
the complete history view to drag and set the range edges, or
use the buttons. Left-side buttons move the start, right-side
buttons move the end, and the middle buttons move the whole
range. The selected start and end date/times are displayed to
each side of the buttons. The default range for the expanded
view is the same as the full-history view.
4 The expanded view enables easy viewing of each 15 minute or
daily event.
5 Mouse over any segment for a summary of its data. Data
displayed is RSL, errored seconds, severely errored seconds,
unavailable seconds, frame loss seconds, events, configuration
changes, and date/time of segment capture.
6 Use these buttons to select graph, report, or combined graph
and report screen views. Graph is the default screen.
Item Description
1 Report screen view is selected.
2 Complete history view.
Item Description
1
2
4
5
3