KBF P + KBF LQC + KBWF (E6) 11/2016 page 130/189
17. Chart recorder display
This view offers graphic representation of the measurement course. Data representation imitates a chart
recorder and allows recalling any set of measured data at any point of time taken from the recorded peri-
od.
17.1 Views
Press the Change view icon to access the pen recorder display.
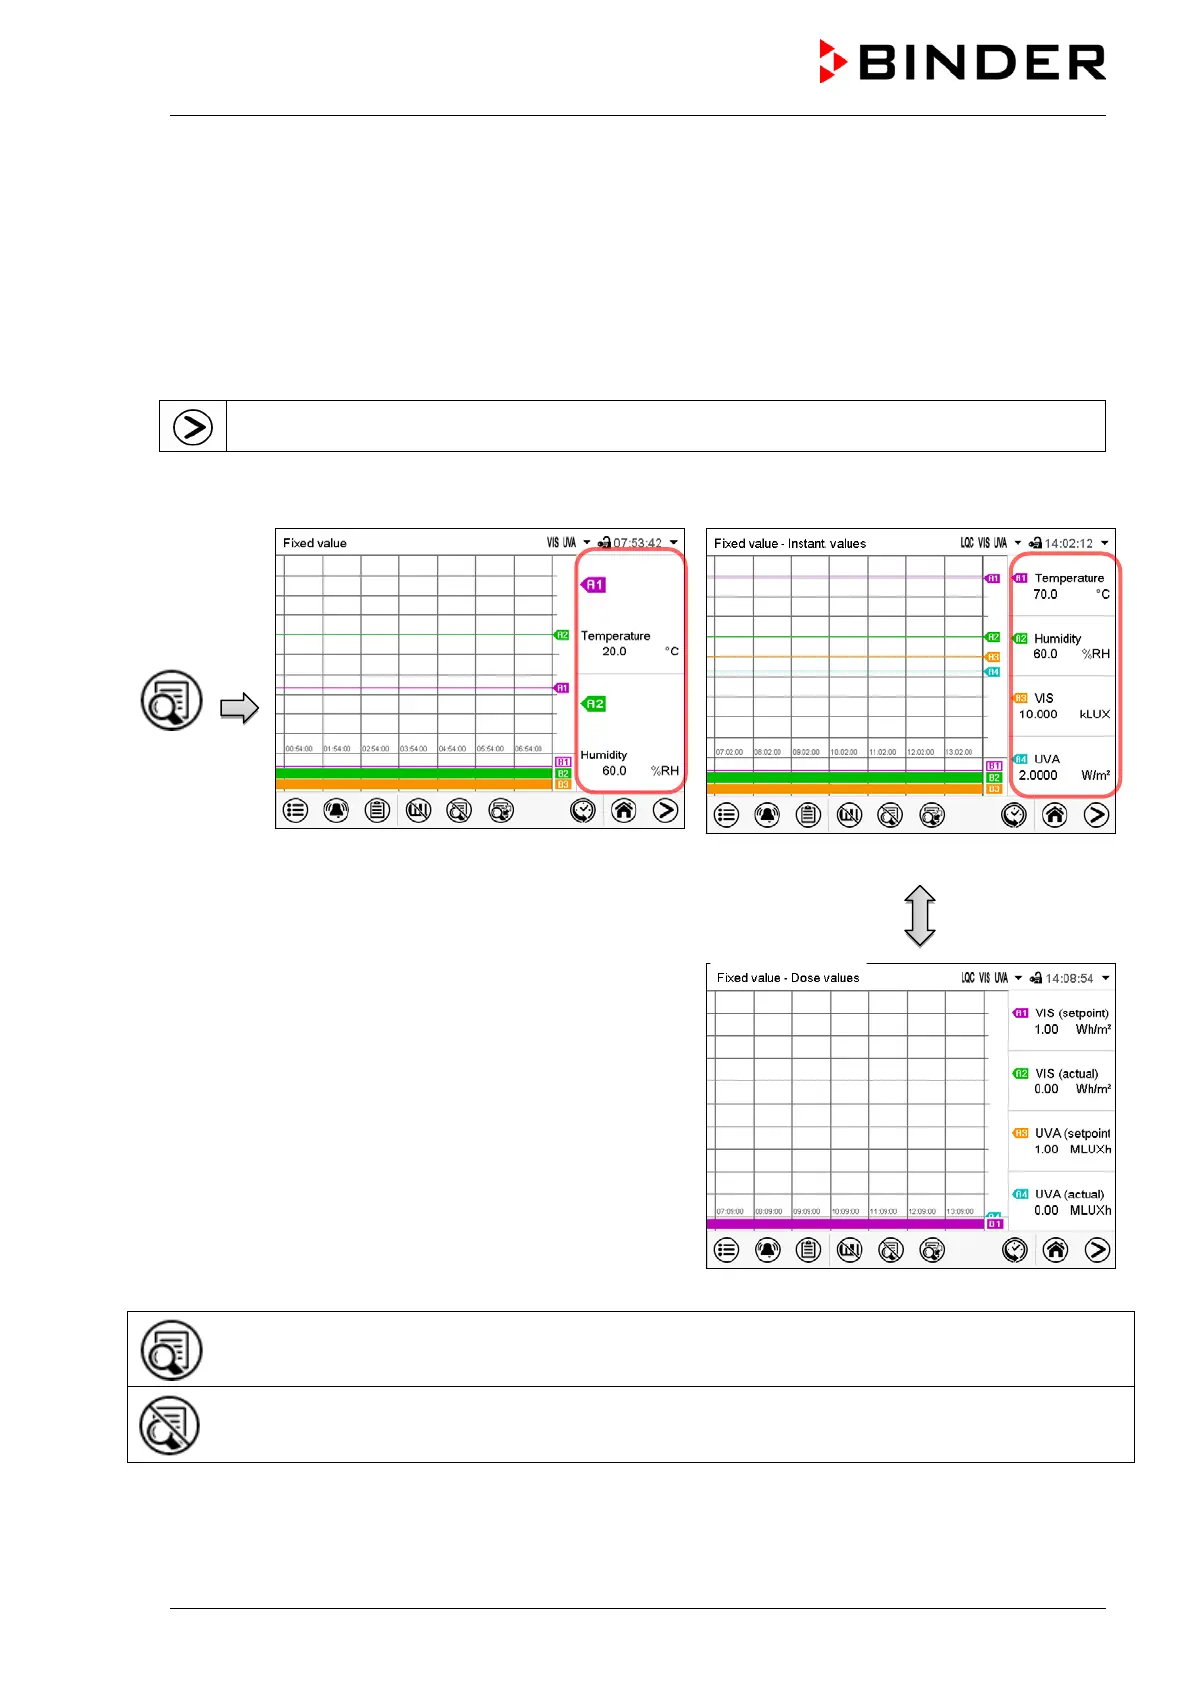
Show and hide the legend:
Display with KBF P / KBWF
Display with KBF LQC – first page
Display with KBF LQC – second page
Show legend on the right side of the display
Hide legend



 To Next Page