Using the M4 TORNADO Software
100
User Manual
6.8.2 Measurement and data evaluation
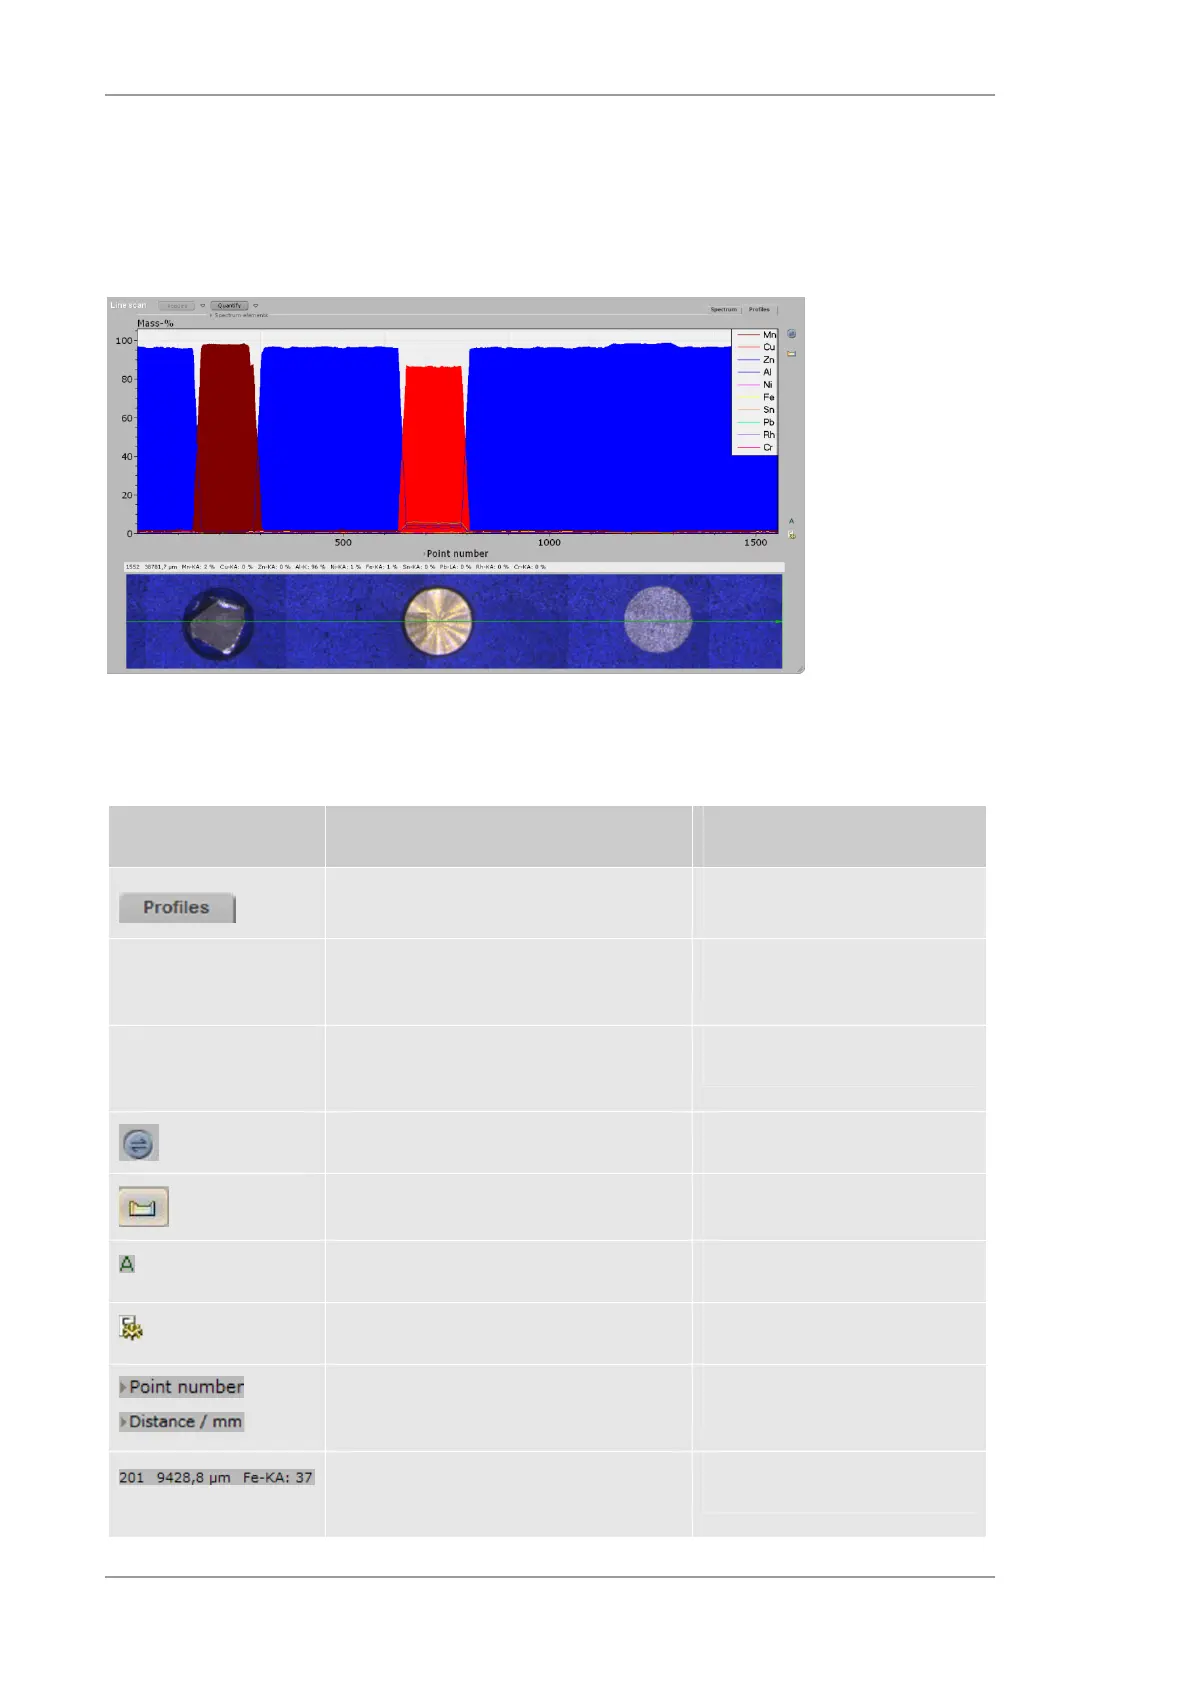
Fig. 42 shows the display of the profiles along the line for selected elements. The presentation of
element profiles can be changed by clicking on the legend. The elements results can be displayed
in absolute or relative scaling.
Fig. 42 Profiles display on the Line workspace
Table 35 Options for data evaluation in the Line workspace
Object Description Hints
Tab to access the profile window
Upper part of the
workspace
Display of the distribution of intensity or
concentration
Lower part of the
workspace
Display of the line scan area in the
sample image
Import/Export menu See Fig. 9
Element identification See section 6.3.3
Auto scale profile window
Options for profile window
Toggle for scaling the X-axis in points or
distance
Display of point, distance and intensity
for selected elements