Using the M4 TORNADO Software
M4 TORNADO
67
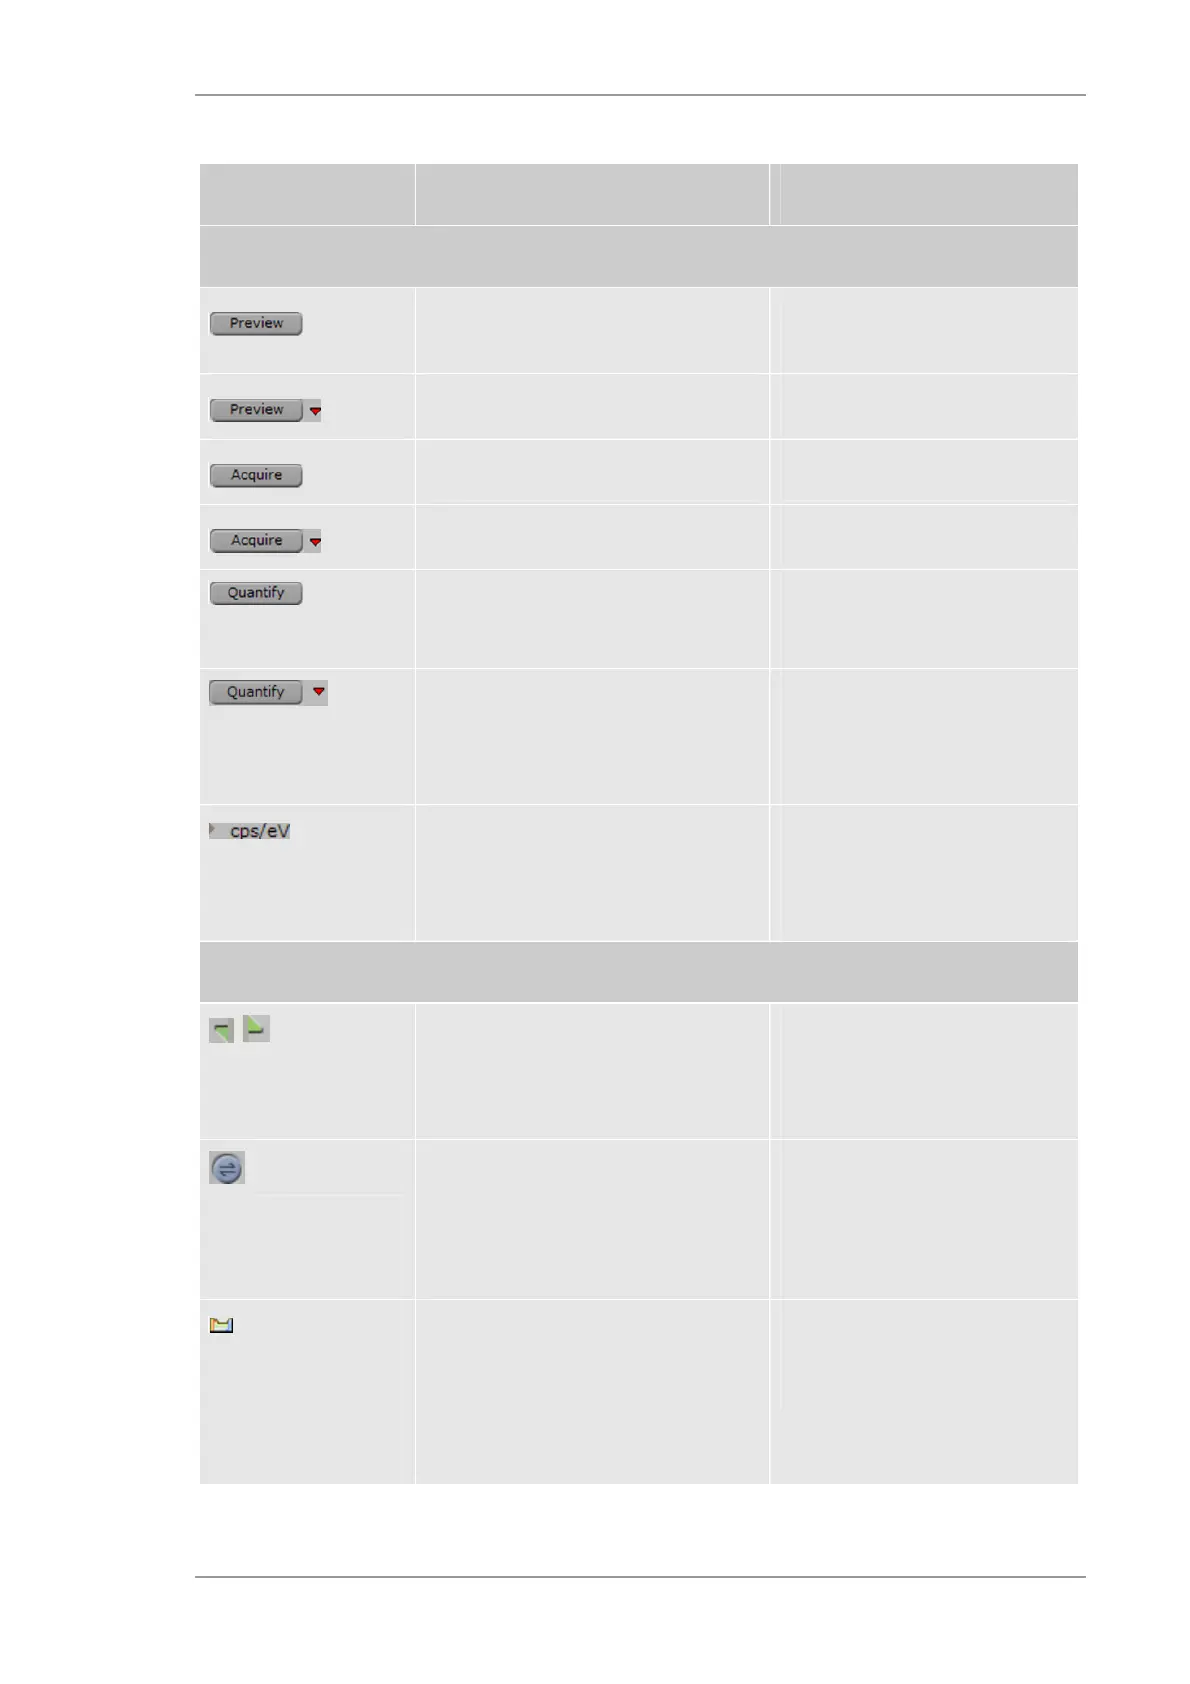
Table 21 Options for spectrum display
Object Description Hints
Function bar above spectrum display
Activates high speed spectra preview Spectrum will be continuously
refreshed
Configures spectra preview Allows settings for refresh time
Acquires a spectrum Starts the measurement
Configures acquisition settings See Fig. 20
Quantifies spectrum
Uses method displayed below the
button
Opens the method editor With the method editor a
modification of the quantification
method is possible (see section
6.4.3.2)
Changes Y-axis units on top of the
Y-axis
Toggles between cps/eV and
Pulses/eV. It also applies to the
similar control above the spectra
list.
Function bar on the right hand side – Display of spectra
Maximize / minimize spectra window in
upper right corner
Toggles between normal and
maximized spectrum window
display (covers project and
devices areas).
Import/Export menu for spectra See section 5.1.4
There is one additional possibility
to save spectra as a list in *.spl
format.
Opens interactive element identification
tool
The element identification will be
performed silmutaneously for all
highlightes spectra.
Clickable periodic table of
elements and peak finder (see
section 6.4.1.1)