Often Used Analytical Procedures
150
User Manual
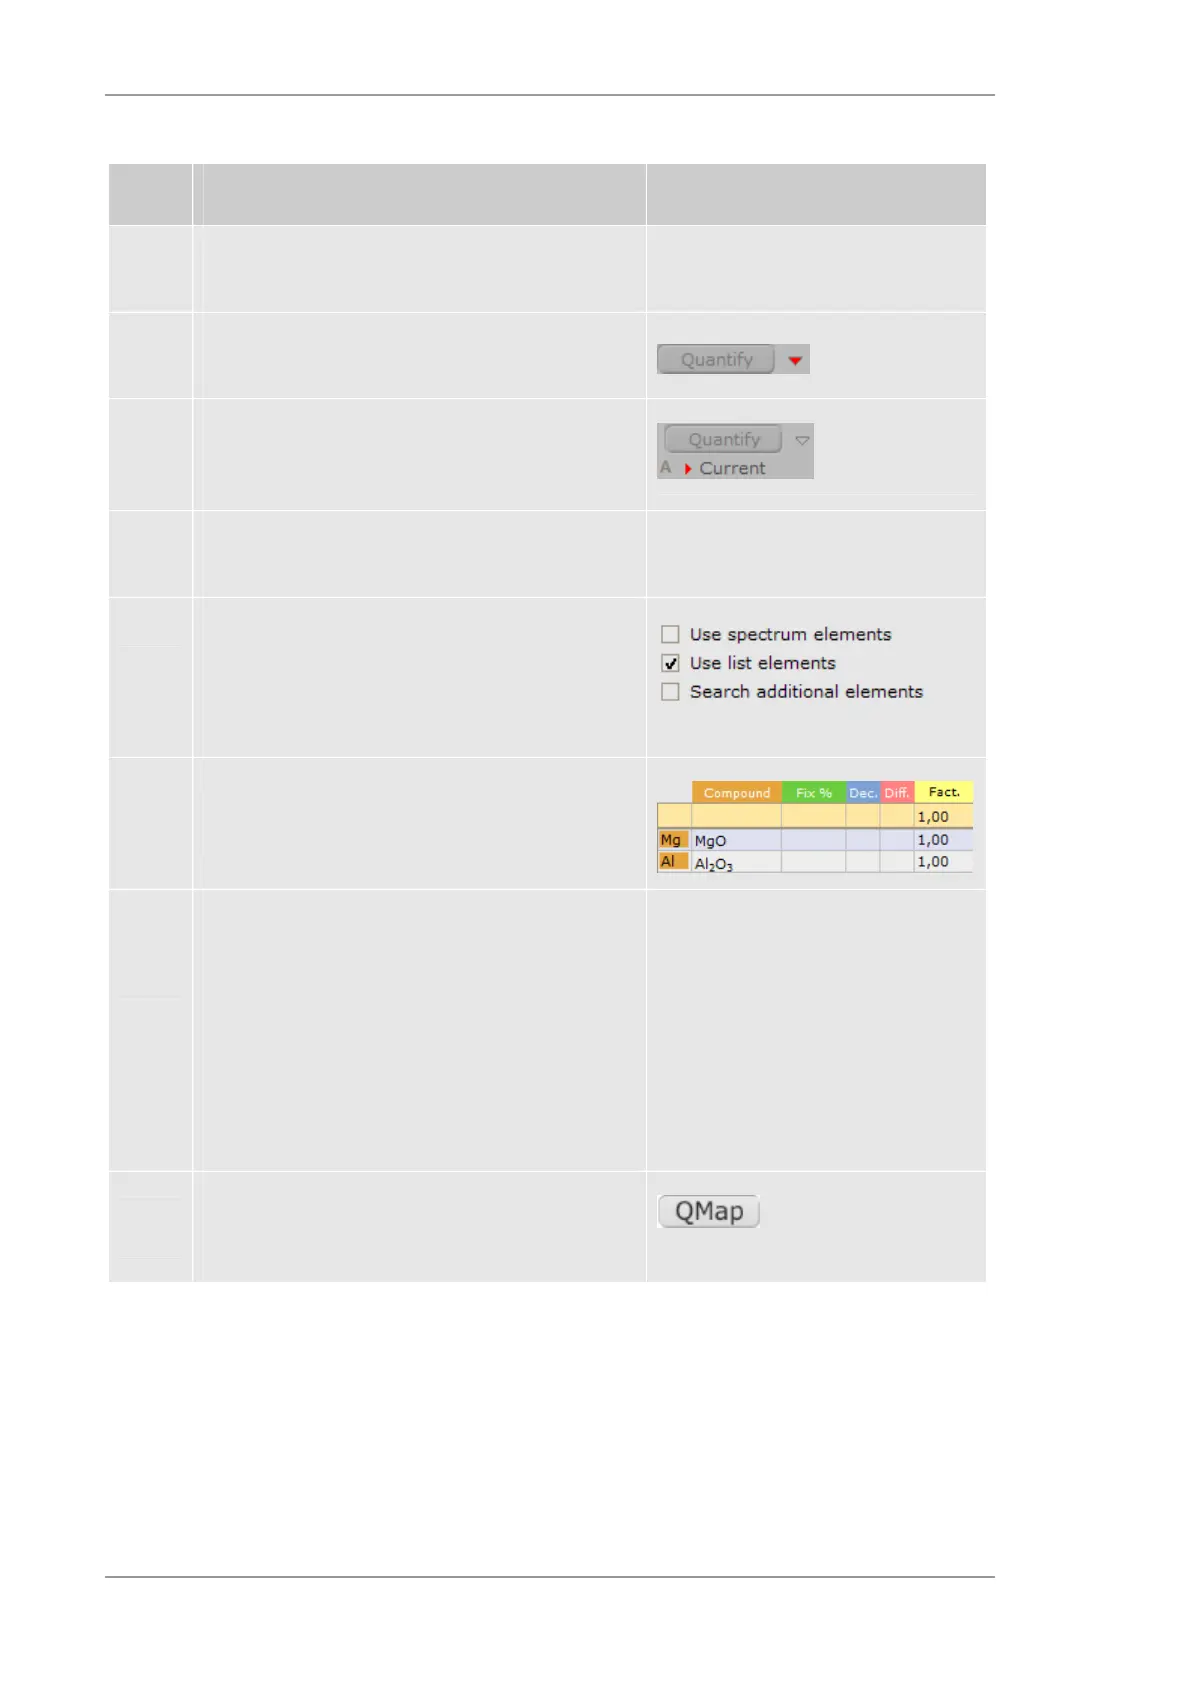
Table 55 Steps for the quantification of distribution measurements
Step Examples/hints
1
Select the element distribution measurement (Area
scan) that should be quantified
2
Select the quantification method via the downward-
facing arrow next to the Quantify button
3
Define the special conditions for the quantification
with the right-facing arrow below the Quantify
button (method editor)
4
Special settings for quantification are possible for
the Fundamental Parameter-model (standardless)
4a
Peak identification as defined
in the actual spectrum
in the displayed list
by automatic identification
4b
Define the special properties of every element
5
Define the resolution for the quantification.
The settings have the following meaning:
1x1 every pixel will be quantified
3x3 pixels are summed up before quant.
5x5 pixels are summed up before quant.
9x9 pixels are summed up before quant.
6
Perform the quantification with QMap. The results
will be displayed immediately in the corresponding
tables