Using the M4 TORNADO Software
104
User Manual
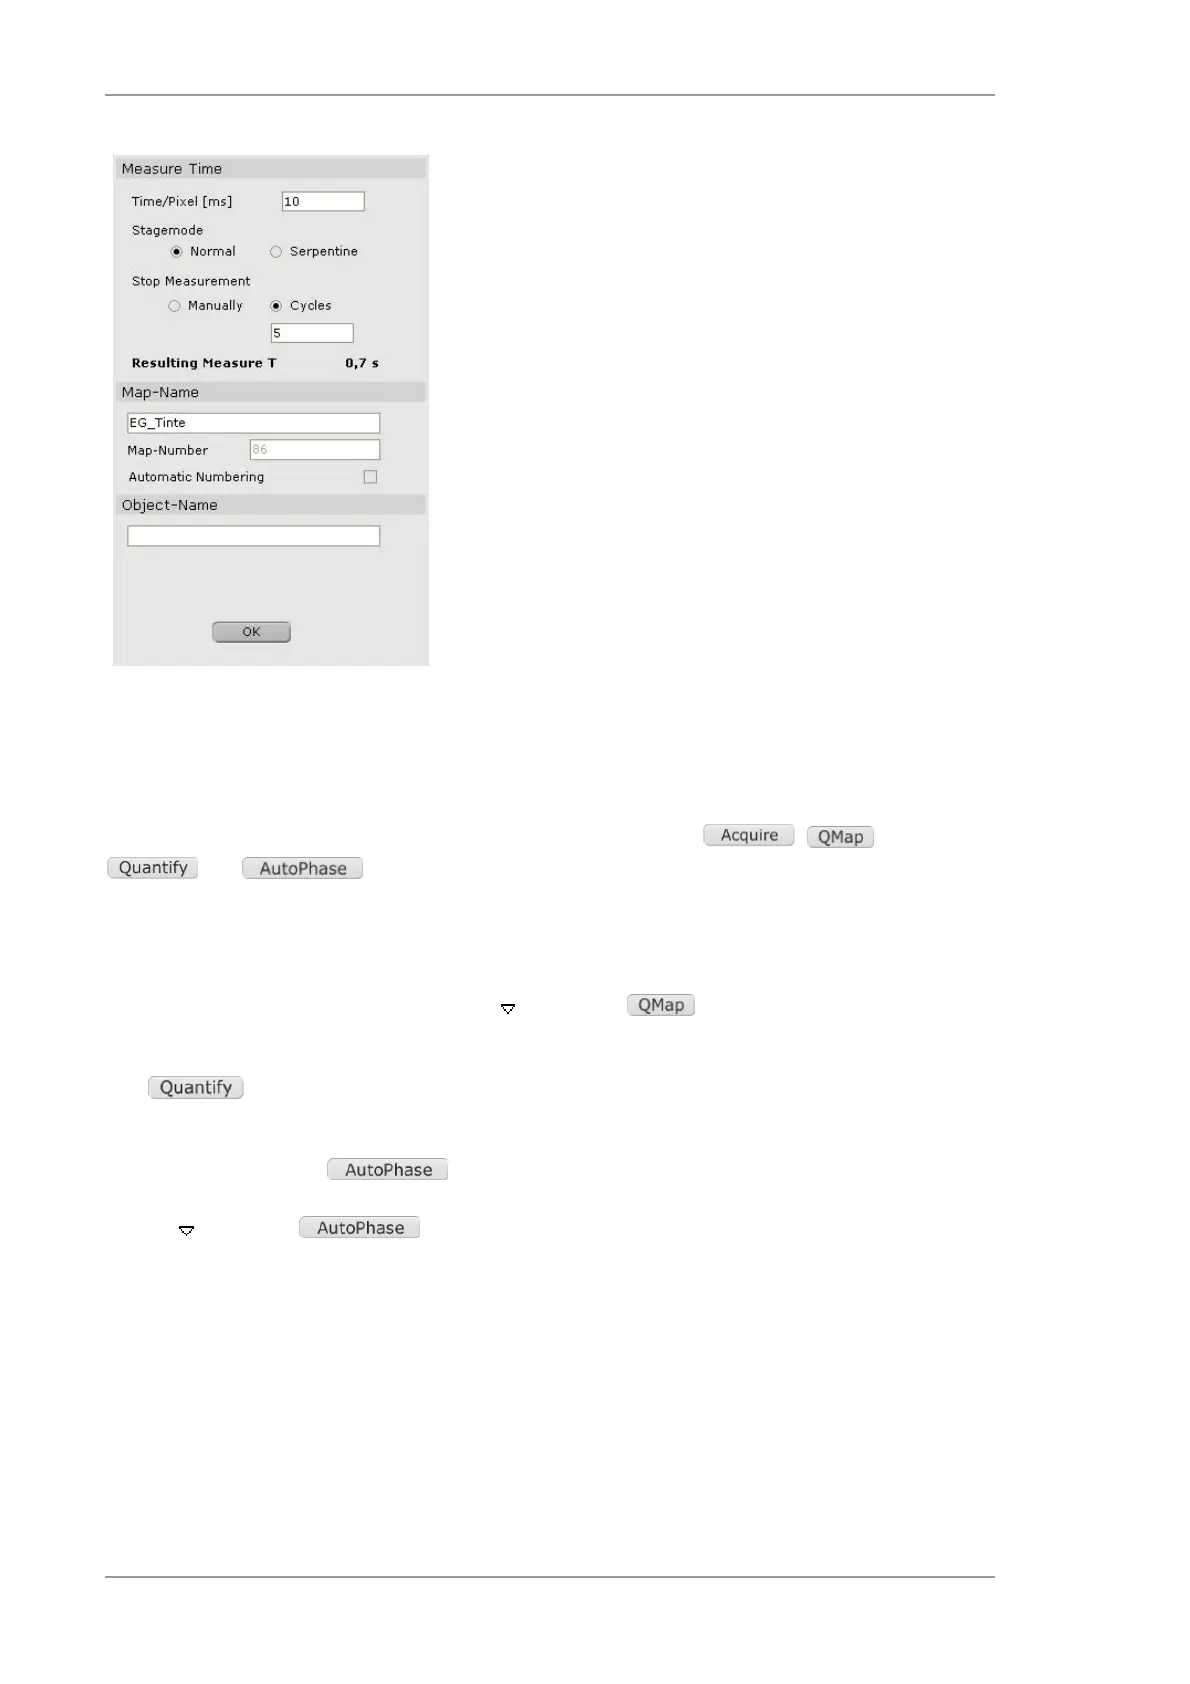
Pre-setting of measurement time
Measurement time per pixel
Mode of stage movement
(It is recommended to use several cycles with shorter
measurement time than one map with long pixel time)
Total duration of measurement
Map denomination by
name
number
object name
Fig. 44 Settings for area data acquisition
6.9.2 Measurement and data evaluation
Data acquisition and evaluation can be done by using four buttons: , ,
and .
Fully quantitative mapping is performed by automatic sequential analysis of the sample image,
acquiring and evaluating spectra pixel by pixel (or predefined binning). The acquired analysis
results are assembled as element maps as with fast mapping, however, the acquired spectra are
not saved. Click the downward-facing arrow next to the button to open the method
browser; click the method name to evoke the method editor for detailed settings.
The button can be used to quantify spectra of selected regions in the Hypermap.
A colored phase image that reveals the local distribution of different phases in a sample can be
produced by clicking the button. This image is created based on the chemical
information stored in every pixel of an acquired map (ROI element map or HyperMap). The
triangle next to the button offers an option for automatically updating the phase
image after changes have been made to the method setup. AutoPhase offers three different
methods to generate a phase image (see 6.9.6.2). The Histogram and Clusters methods
operate automatically, whereas the Objects method requires the user to supervise the process.
 Loading...