Often Used Analytical Procedures
M4 TORNADO
149
Step Examples/hints
6a
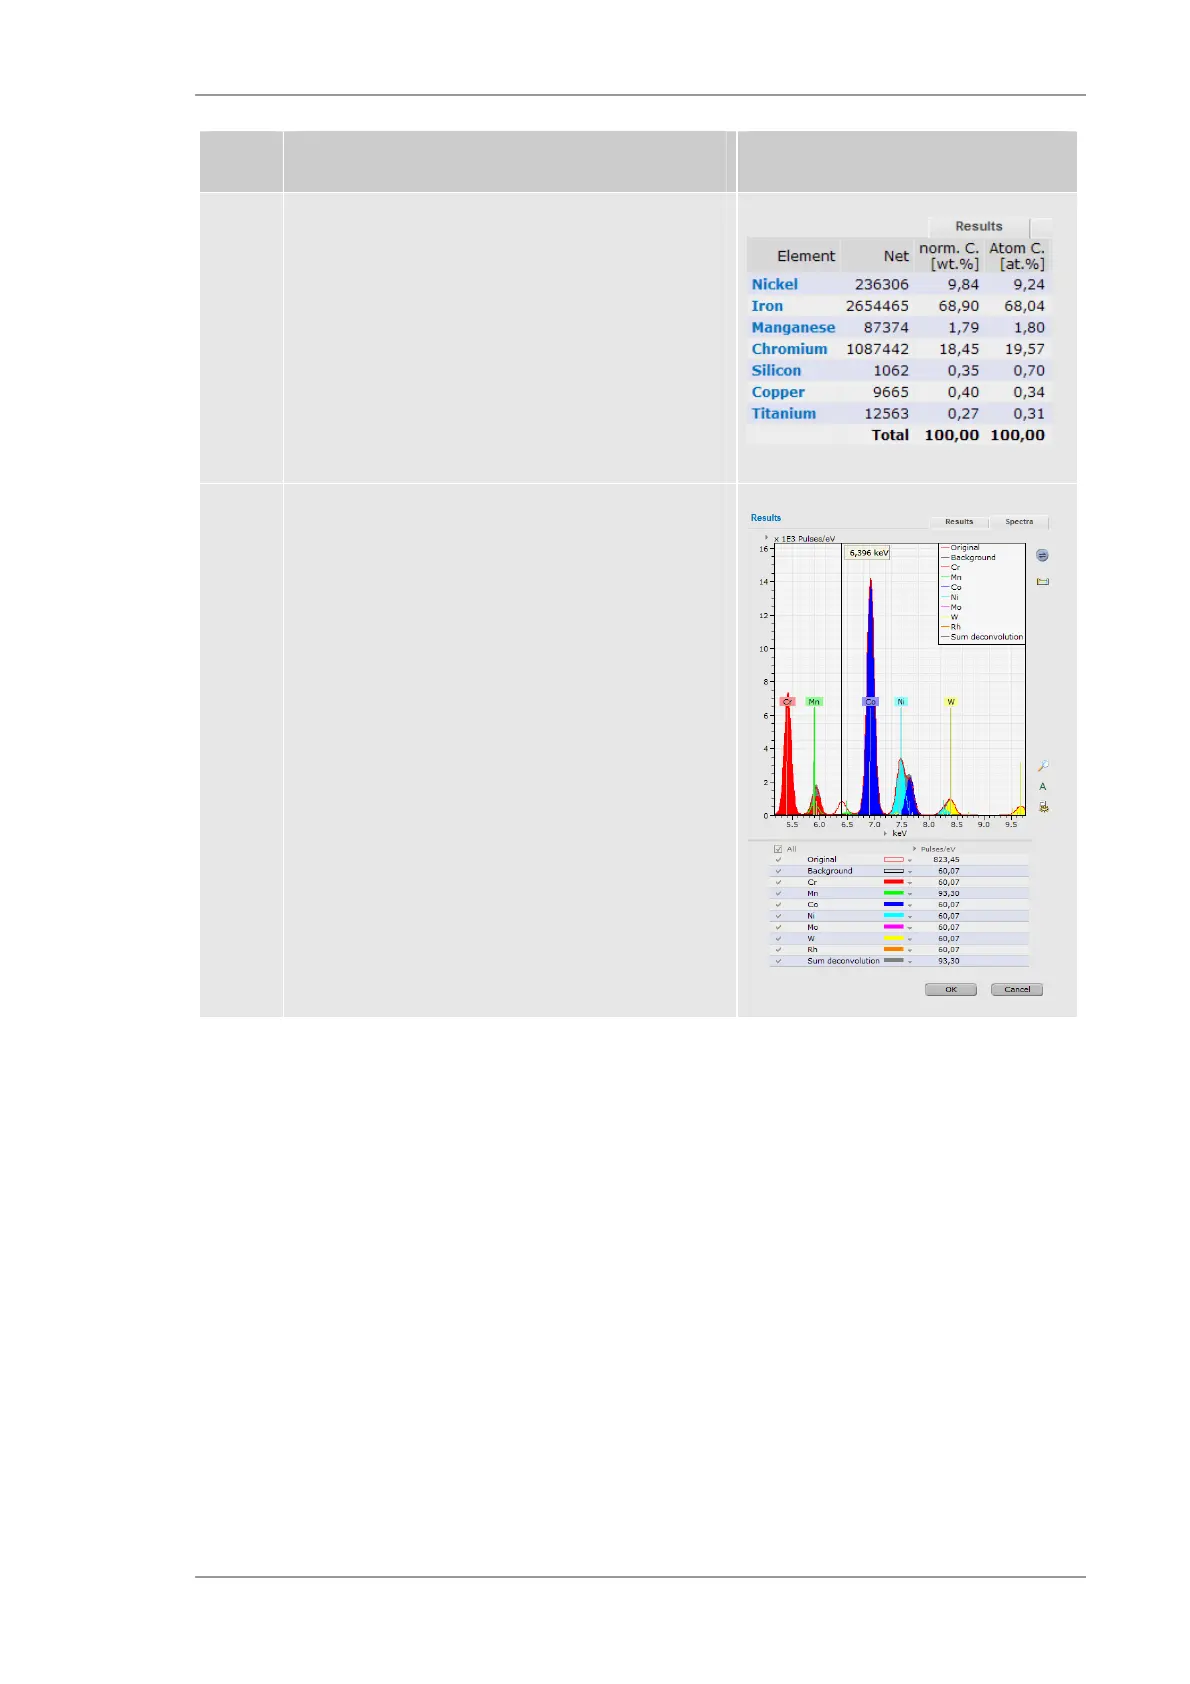
In case of the automatic quantification the results
will be displayed immediately in the corresponding
tables. The Result tab shows the results for the
highlighted spectrum. The table below the spectra
shows the results for all spectra.
In case of the interactive quantification the screen
for element settings will be opened.
The tab Result will display the quantification
results.
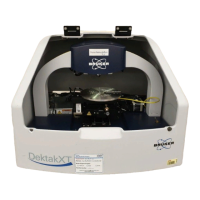
6b The tab Spectra shows the original spectrum, the
calculated background spectrum , the fitted single
element spectra, and the sum. This allows the
identification of missed elements (e.g. Fe at the
marked cursor position at 6.396 keV) which could
be immediately included into the quantification
using the periodic table on the right hand of the
spectrum.
7.7.2 Quantification of distribution measurements
Spectra measured in single pixels of distribution measurements (LineScan, Mapping) contain all
information for quantification. The quantification can be done by the described procedures for
single points (see 7.7.1). Due to the very short measurement time per pixel as well as the large
number of pixels, in particular for mappings which would require a long calculation time, the
mapping pixels can be binned for quantification.