Using the M4 TORNADO Software
M4 TORNADO
107
Object Description Hints
Element / phase contribution
control for every element
Controls color intensity of element/phase,
switches on/off (check box) contribution to
map or phase image, or changes the
associated color by clicking on the color field
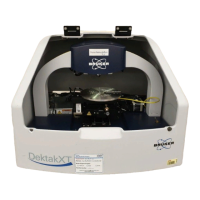
6.9.3.1 Display of mapping information
The measurement conditions for the mapping can be displayed with the following dialog opened
by the icon.
The measurement conditions of mappings are
displayed for
the size of the mapping (in pixel and µm) and pixel
size
the number of frames and the measurement time
(per pixel and total)
the excitation conditions (tube parameters, filter)
Fig. 47 Display of mapping information
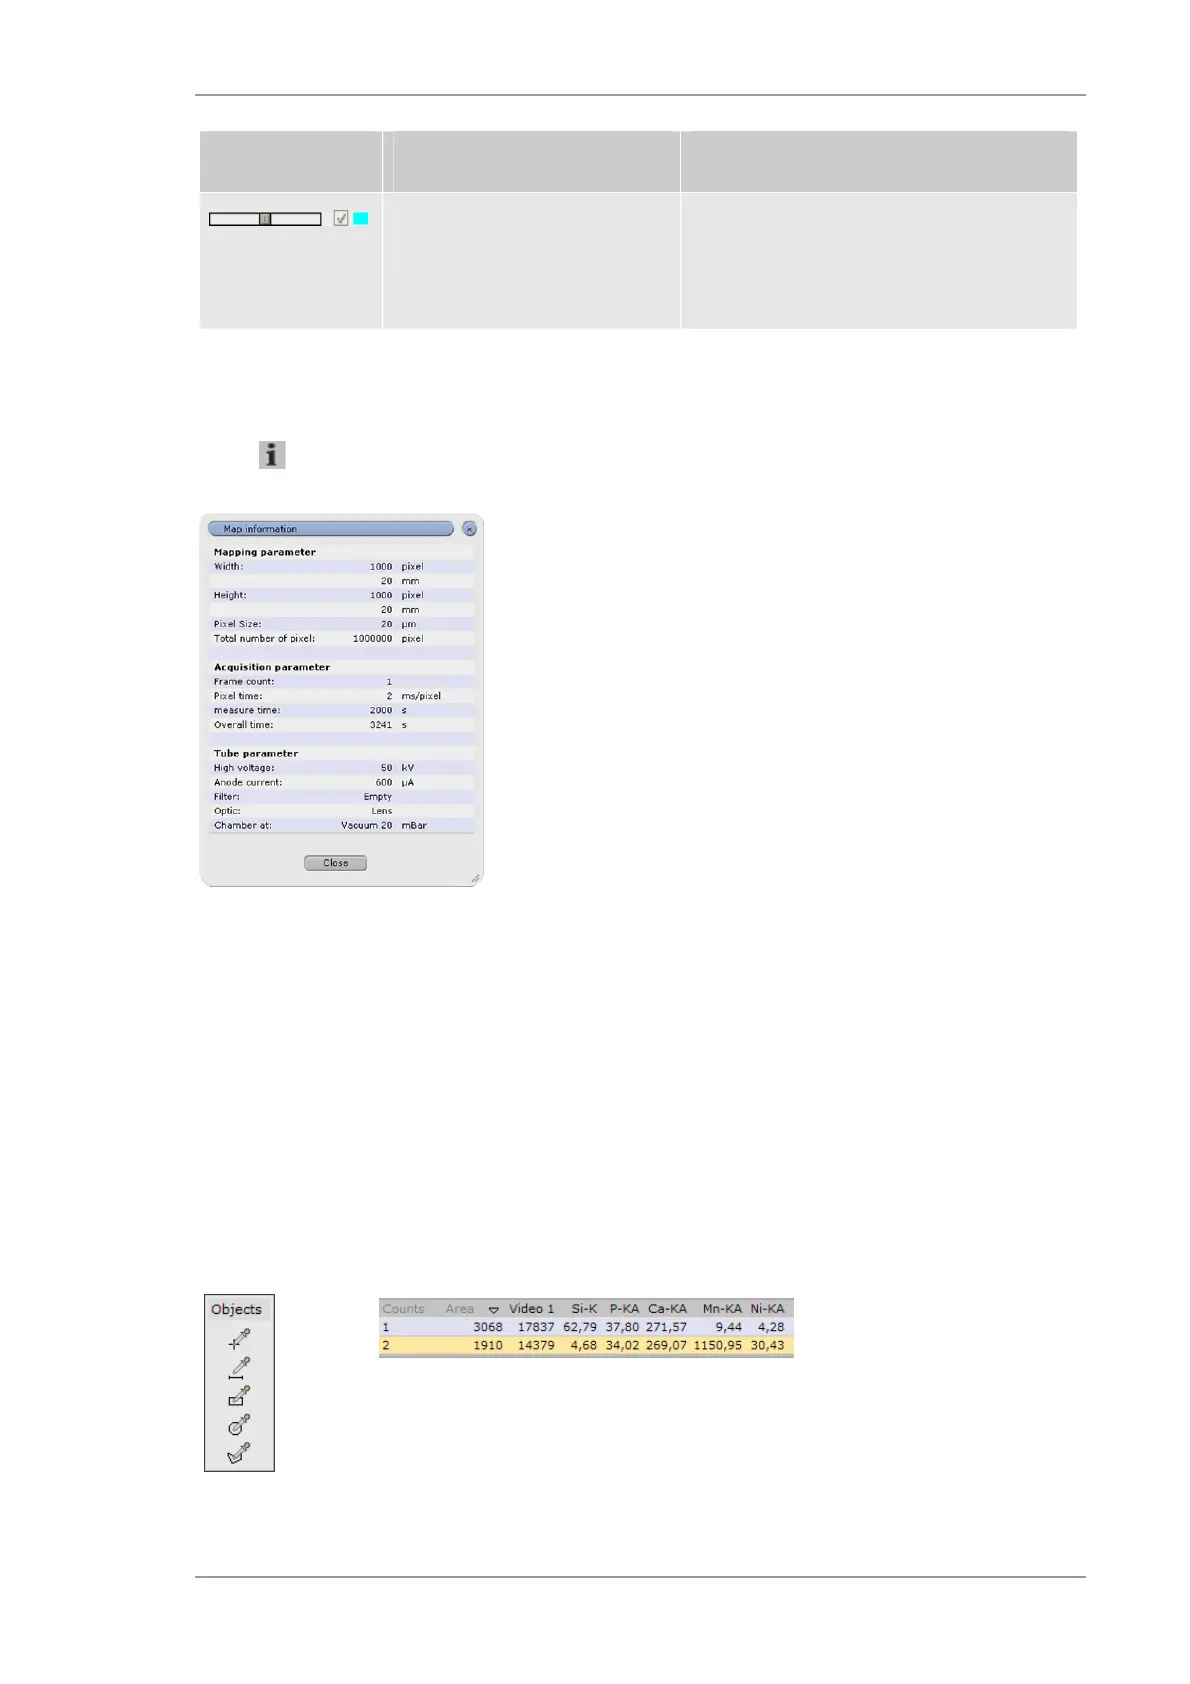
6.9.3.2 Defining objects
Points, lines, rectangles, ellipses and polygons can be drawn as an object into the map. For those
objects, the sum spectra will be calculated and displayed in the Spectrum tab.
In case of drawing a line, a line scan will be calculated from the element distribution for the
selected elements and displayed in the Line scan tab.
Objects are mentioned in the table below the map result window with their number, number of
points and intensities for the identified elements.
Fig. 48 Definition of objects on a map
 Loading...