Using the M4 TORNADO Software
M4 TORNADO
113
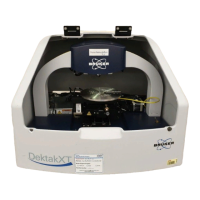
Fig. 53 The Phases tab
The clipboard at the bottom of the phase display contains the original image and, for each
individual phase (P1 to Pn), a colored image showing the area it occupies. The list below the
phase image displays for each individual phase (P1 to Pn) values for the occupied area (in pixels,
µm
2
/mm
2
or %) and the total number of counts for the ROI of every element chosen to be
displayed in the clipboard under the Map result tab.
The Phases tab offers the following functionalities:
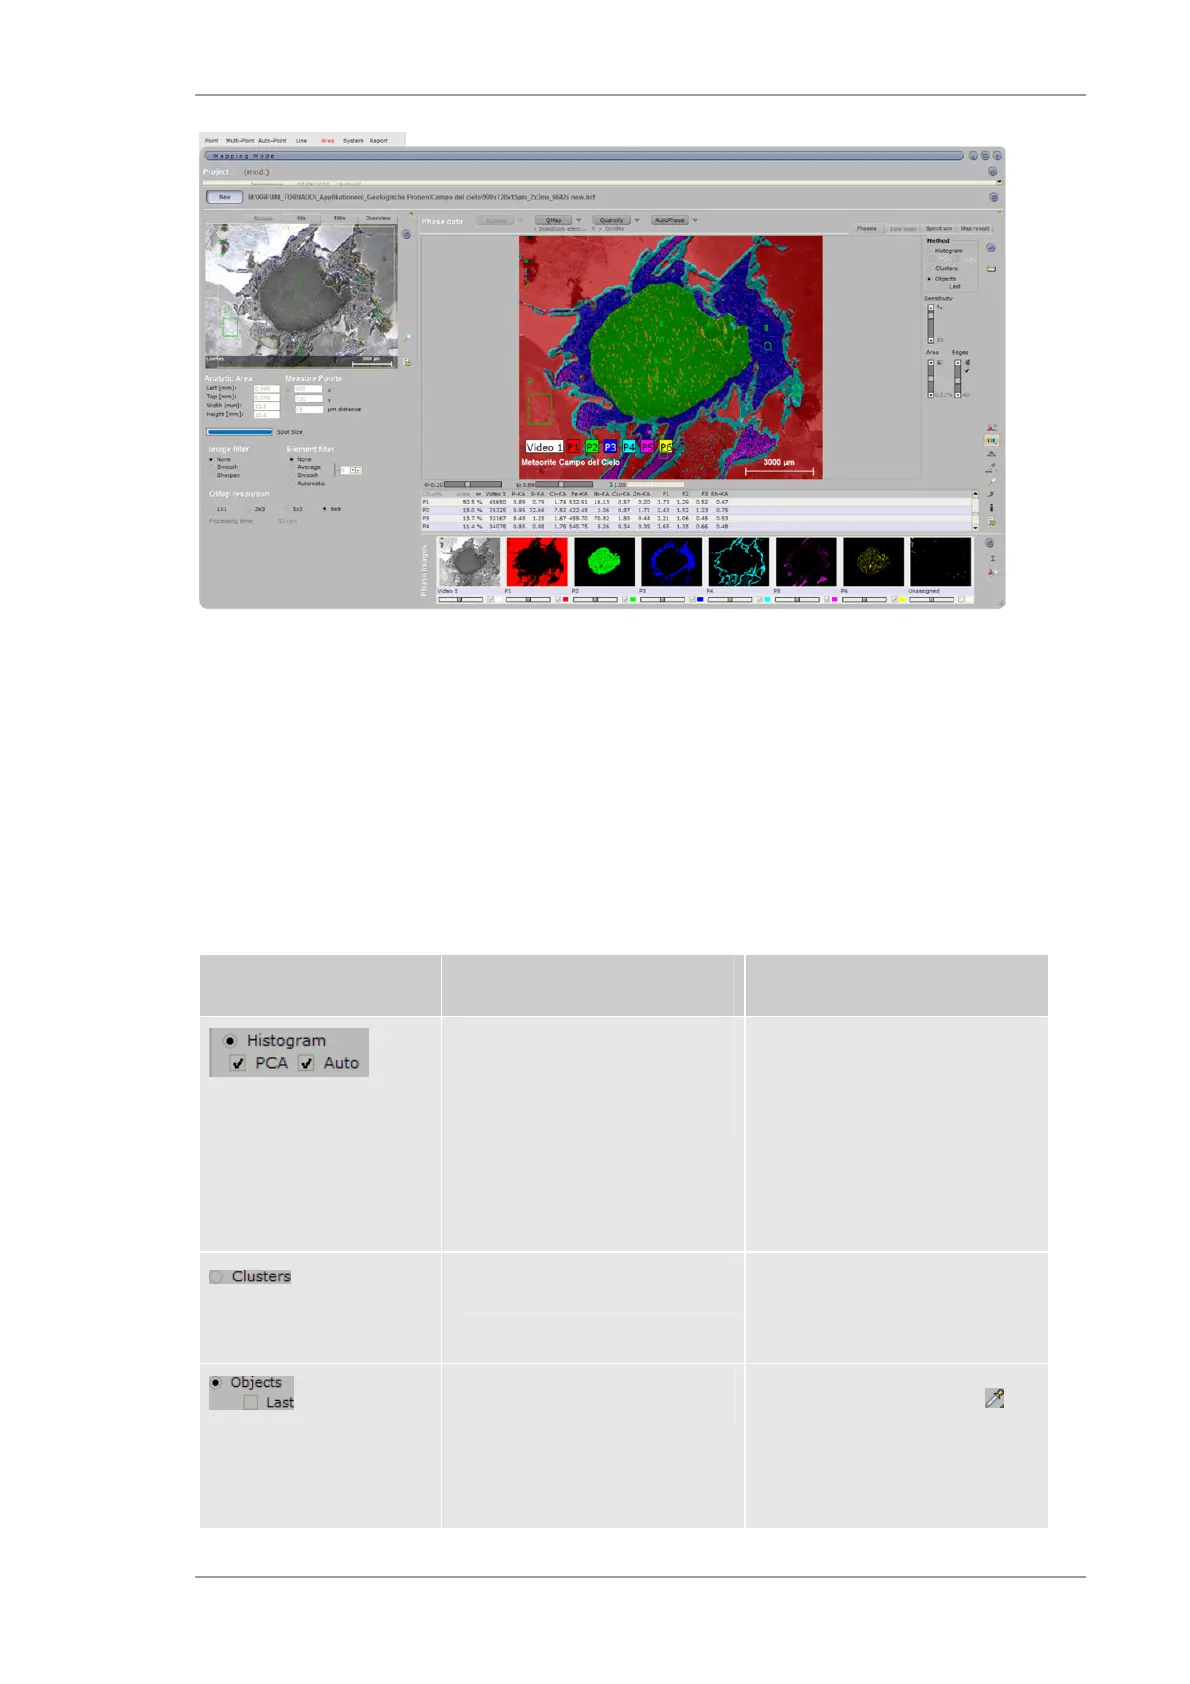
Table 40 Options of the Phases tab
Object Description Hints
Activates histogram method,
enables PCA and auto binning
Works directly on the element
intensities (QMap:
concentrations), optionally
performs Principal Components
Analysis (PCA) before binning,
optionally creates bins
automatically instead of fixed
size
Activates clustering method Uses a cluster method for
feature analysis to create phase
image.
Uses drawn objects
Uses objects drawn with the
tool in the map display to
determine phases, optionally the
objects drawn for the last
analysis can be recycled.
 Loading...