Using the M4 TORNADO Software
M4 TORNADO
101
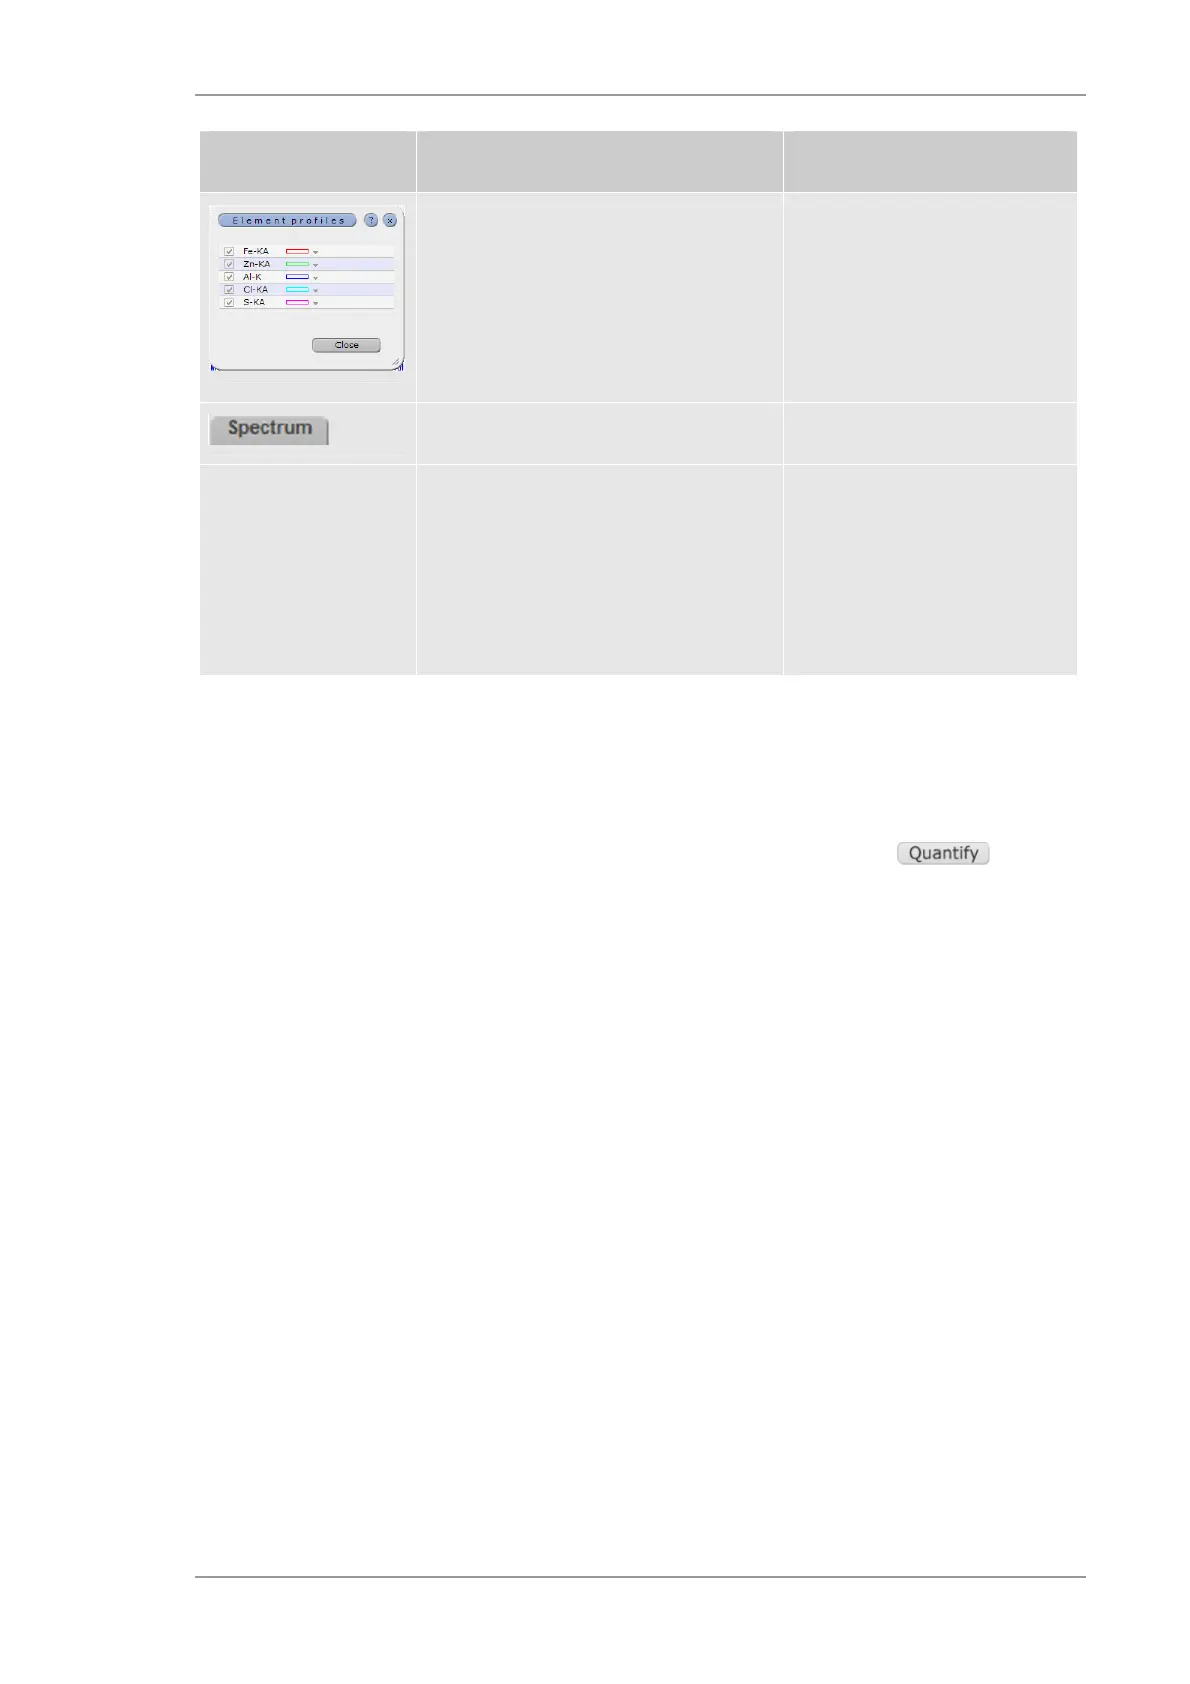
Object Description Hints
Definition of the presentation of line
scans
It is possible to change the color, width
and type of the lines (downward-facing
arrow) and to toggle between dots and
bar for the presentation
Open with double click on the
legend
Tab to access spectrum window For details see section 6.3.1
Cursor
The cursor can be moved along the
profile. The spectrum of the current
cursor position will be displayed. It is
also possible to define a section of the
line scan (Click&Drag). The sum-
spectrum of this section will be
displayed.
6.8.3 Quantification of line distributions
Since a complete spectrum is saved for every point of a line scan, it is possible to quantify the
spectra and calculate the concentration distribution along the line. For that purpose, the
quantification method has to be selected as described in section 6.4.3.1. The model can be
adapted to the analyzed sample. The quantification run can be started with the button.
The quantification will be performed for every point of the line scan and the results are displayed
in the Profiles tab normalized to 100 %.