Using the M4 TORNADO Software
124
User Manual
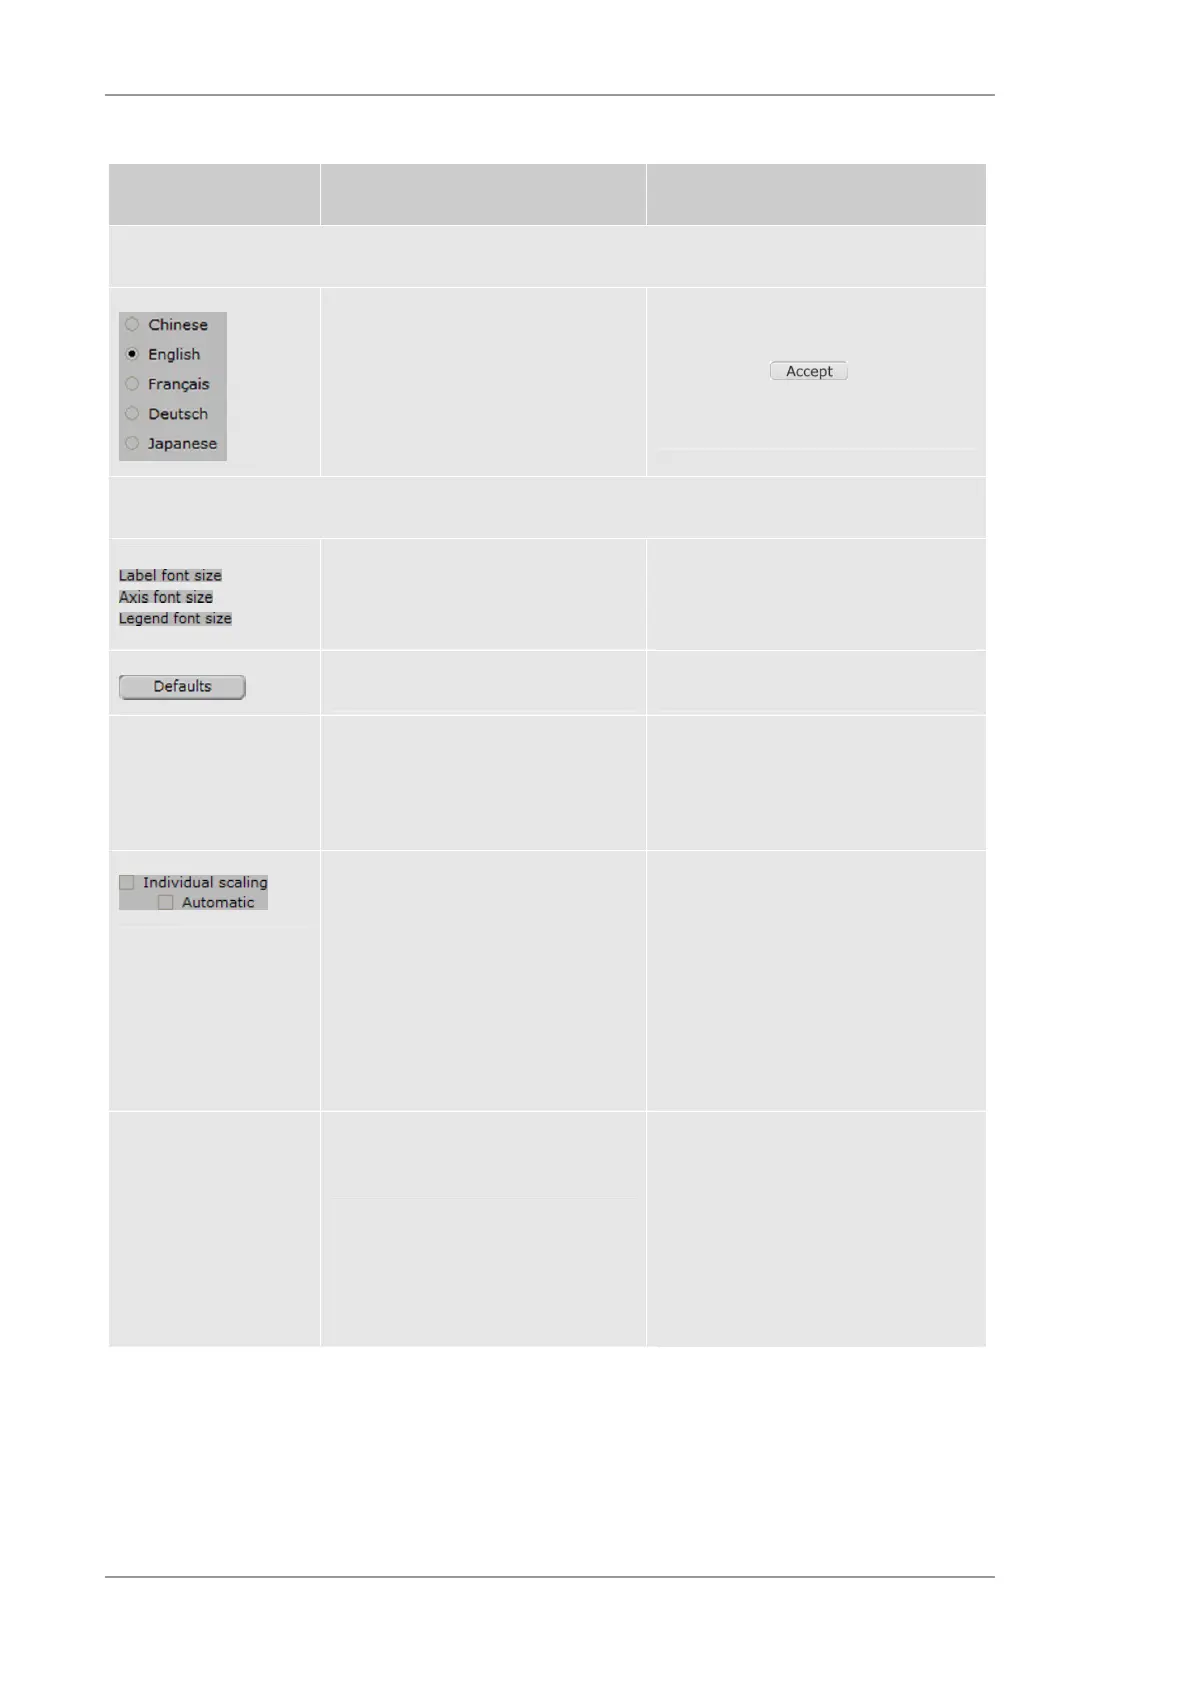
Table 43 Functions in the User interface panel
Object Description Hints
Section Languages
Use of the language of the interface The languages will be changed on
line. The selection must be confirmed
by clicking on
Section Spectrum / Line scan chart settings
Set font size of the labels, the axis
and the legend
Use slide control to set the font sizes
between 8 and 16 pt., choose bold
print if desired
Reset all font sizes to defaults
Y - Axis Settings for the Y-axis Scaling in Counts/s or Pulses/eV
Displays the Y-axis in linear,
logarithmic, square root scale
Individual Y-axis scaling
If Individual scaling is checked,
different Y-axis scaling for every
spectrum in the list will be accepted.
If Automatic is checked, you may
right-click and drag the mouse across
an area of the spectrum window. All
background spectra will be scaled to
this region of the foreground
spectrum (normalization).
Additional Allows settings for the spectrum
display
Displays the X-axis in energy or
channels
Displays the spectrum as bar graphic
or in interpolation
Displays the grid
Shows the legend for the displayed
spectra
Displays spectra filled or with dots