Using the M4 TORNADO Software
M4 TORNADO
105
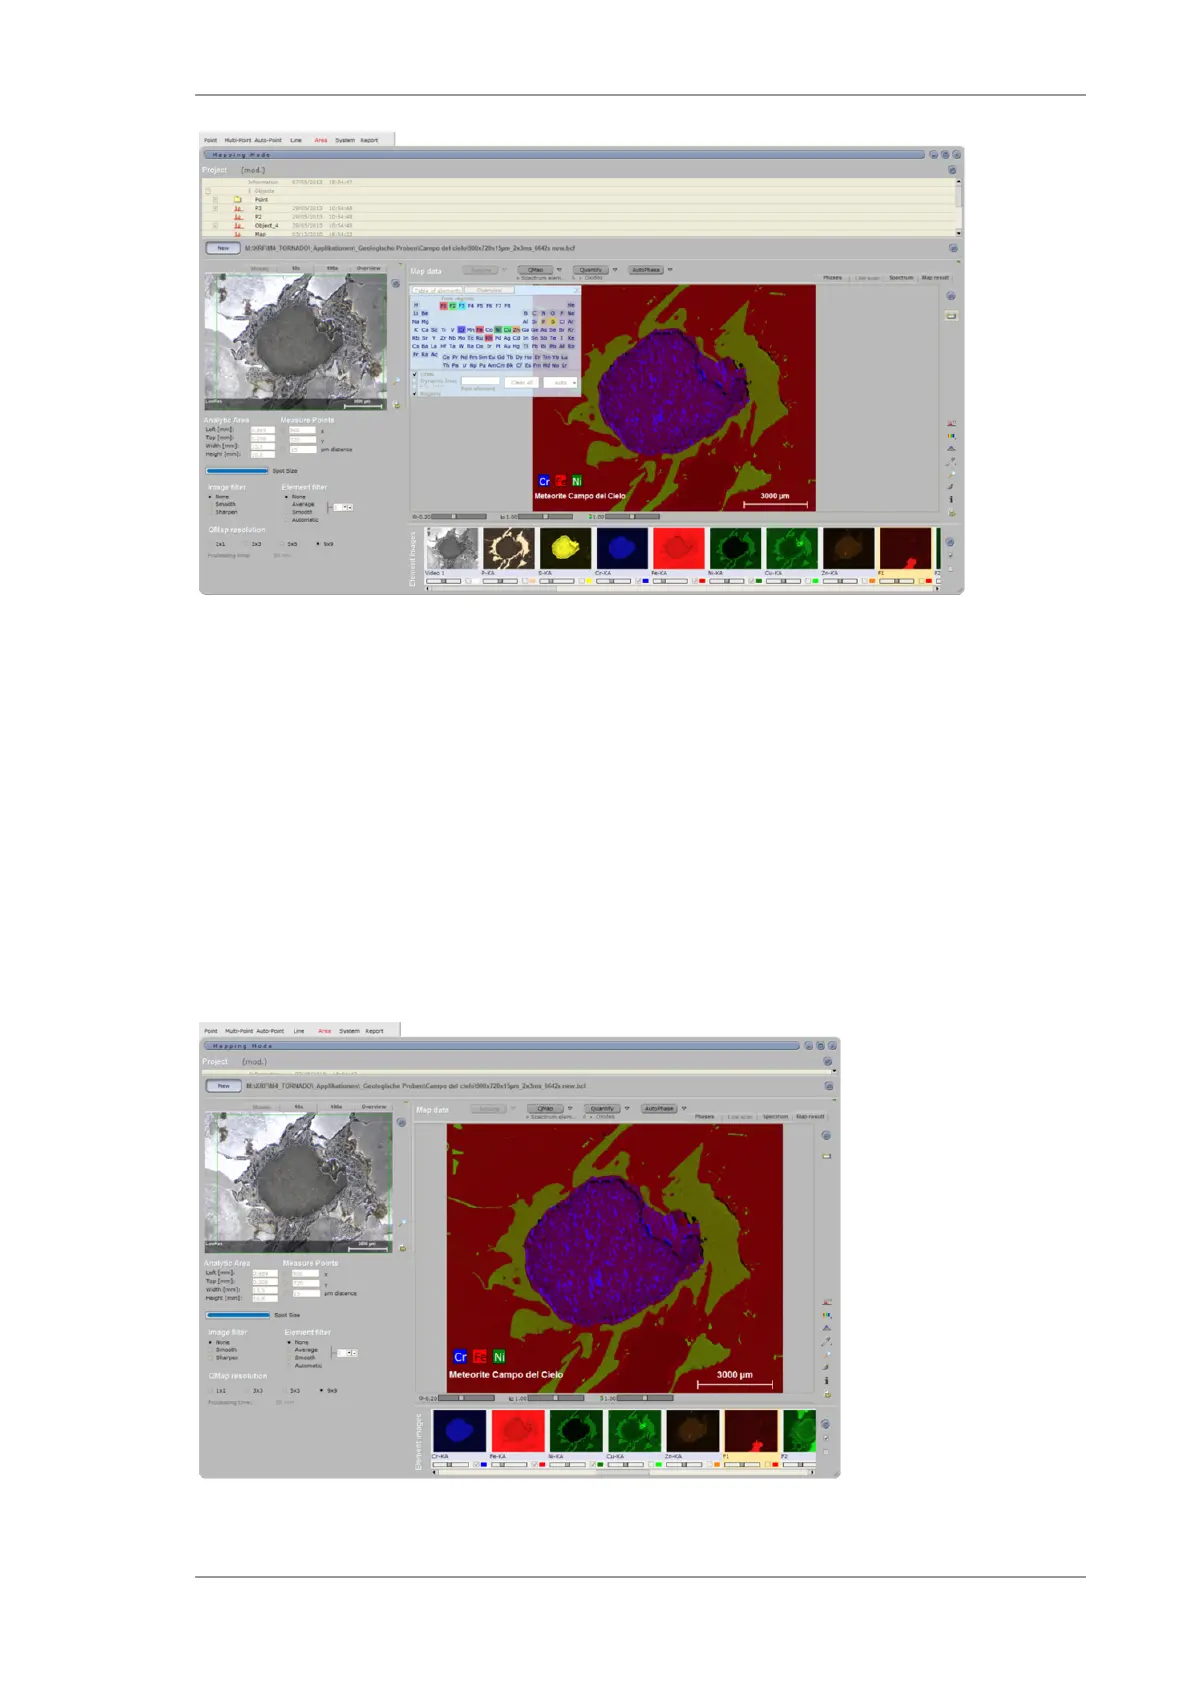
Fig. 45 Map data on the Area workspace
The presentation of the data set can be done as
Element distribution map – Map result tab
Spectra from different objects – Spectrum tab
Element distribution along any line in the map – Line scan tab
Phase analysis – Phases tab.
The corresponding presentation mode can be selected with the tabs that will be described in the
next sections.
6.9.3 The Map result tab
Fig. 46 Map result display on the Area workspace
 Loading...