Using the M4 TORNADO Software
82
User Manual
After the identification has been completed, click the button to go back to the original
spectrum display and to see the quantification results on the right hand side of the dialog and
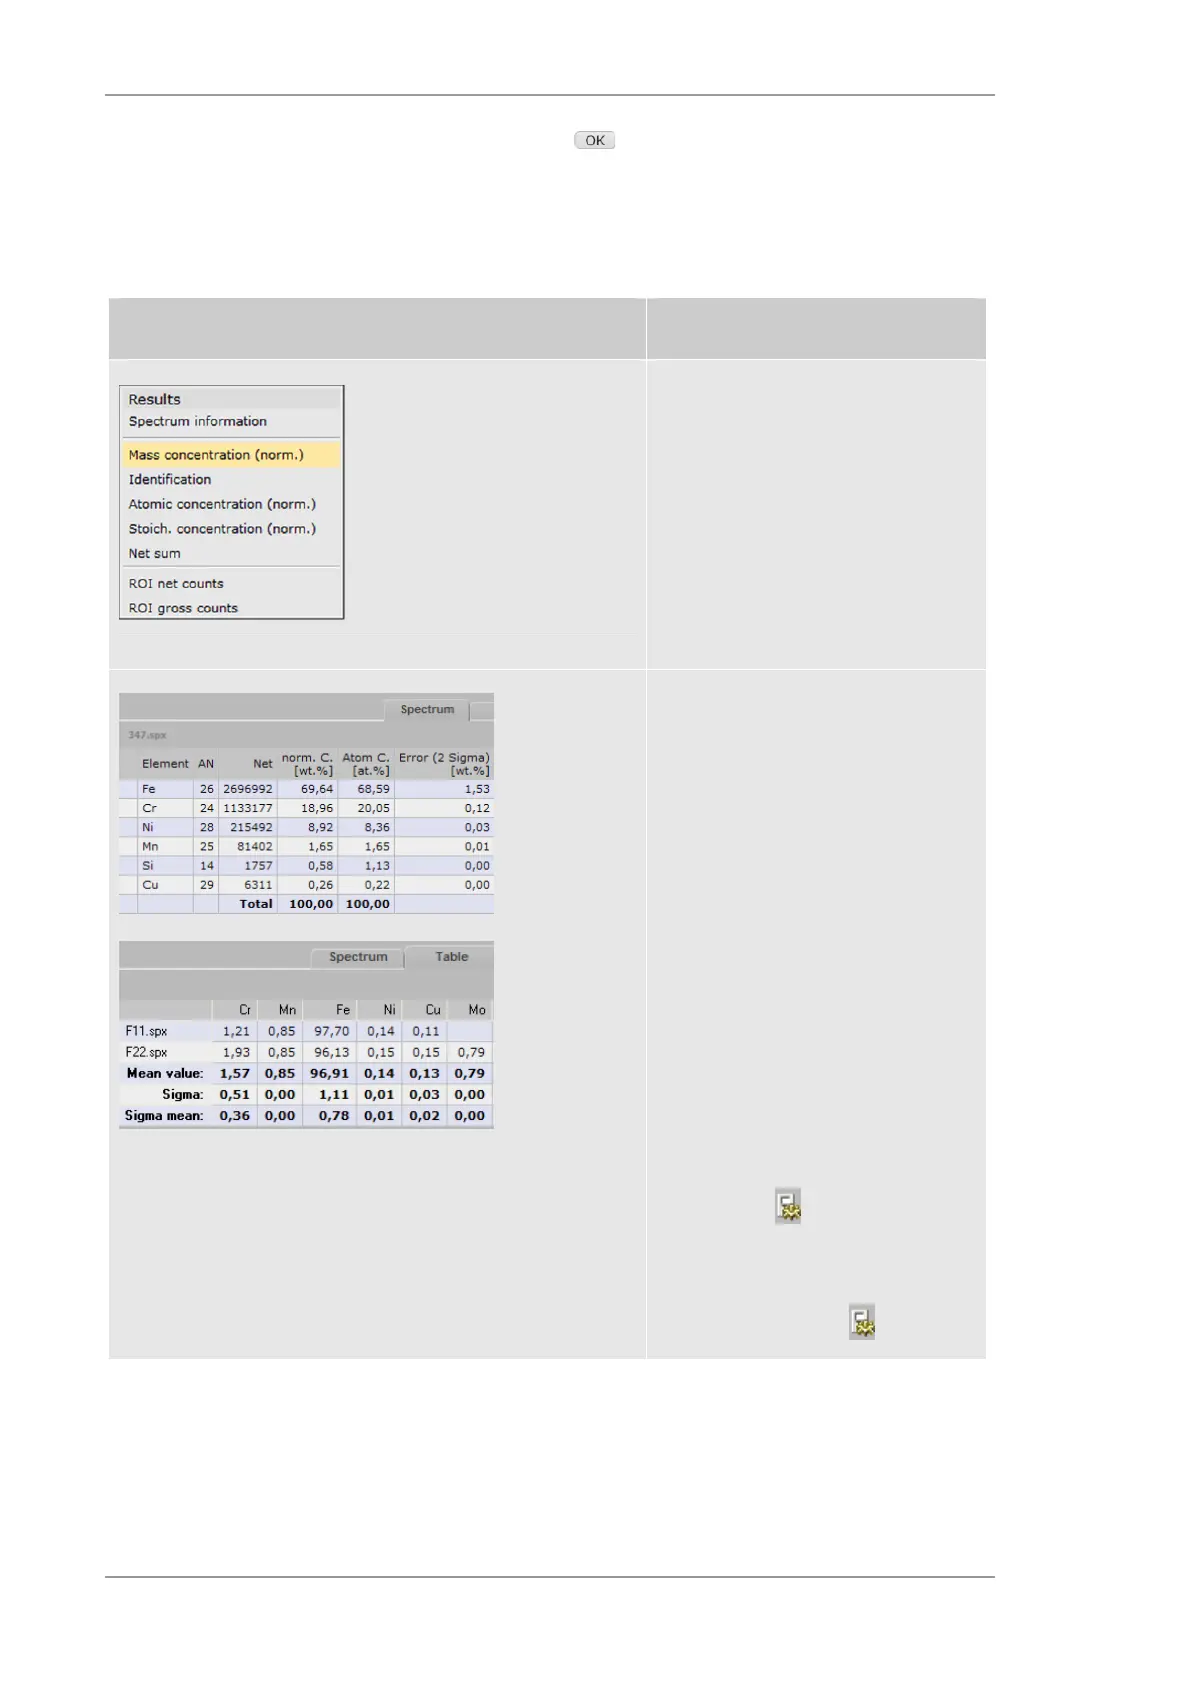
below the spectrum display. There are two tabs: Spectrum displays the results of the current
spectrum, Table shows the results for all measurements of the series.
Table 28 Quantification results display
Result display Description
In the spectrum line below the
spectrum display
In this position only one result can be
shown. This can be selected via the
pull down menu that can be opened
with the triangle on top of the
spectrum lines. Here it is also
possible to define the sequence of
displayed results (atomic number or
result).
On the right hand side of the screen
The Spectrum tab displays the
results for the current spectrum with
the statistical error Sigma (see Table
3. The Table tab displays the results
of N measurements together with the
mean value and the standard
deviation Sigma of the N results.
Sigma mean is the standard error of
the mean values, calculated by
division of the mean value with the
square root of N and therefore gives
a quality for the mean value based on
the amount of measurements (N) but
not the results.
The data presented under Spectrum
depends on the settings in the
method editor. They can be adapted
by clicking the icon.
The Table tab displays the mass
concentrations. This can also be
changed by clicking the icon.
6.4.3.4 Spectrum control
A double click on the spectrum line below the spectrum display opens the Spectrum properties
dialog, which provides spectrum information and allows a special energy calibration. The dialog is
divided in three tabs: Results, Parameter and Spectrum.