Using the M4 TORNADO Software
110
User Manual
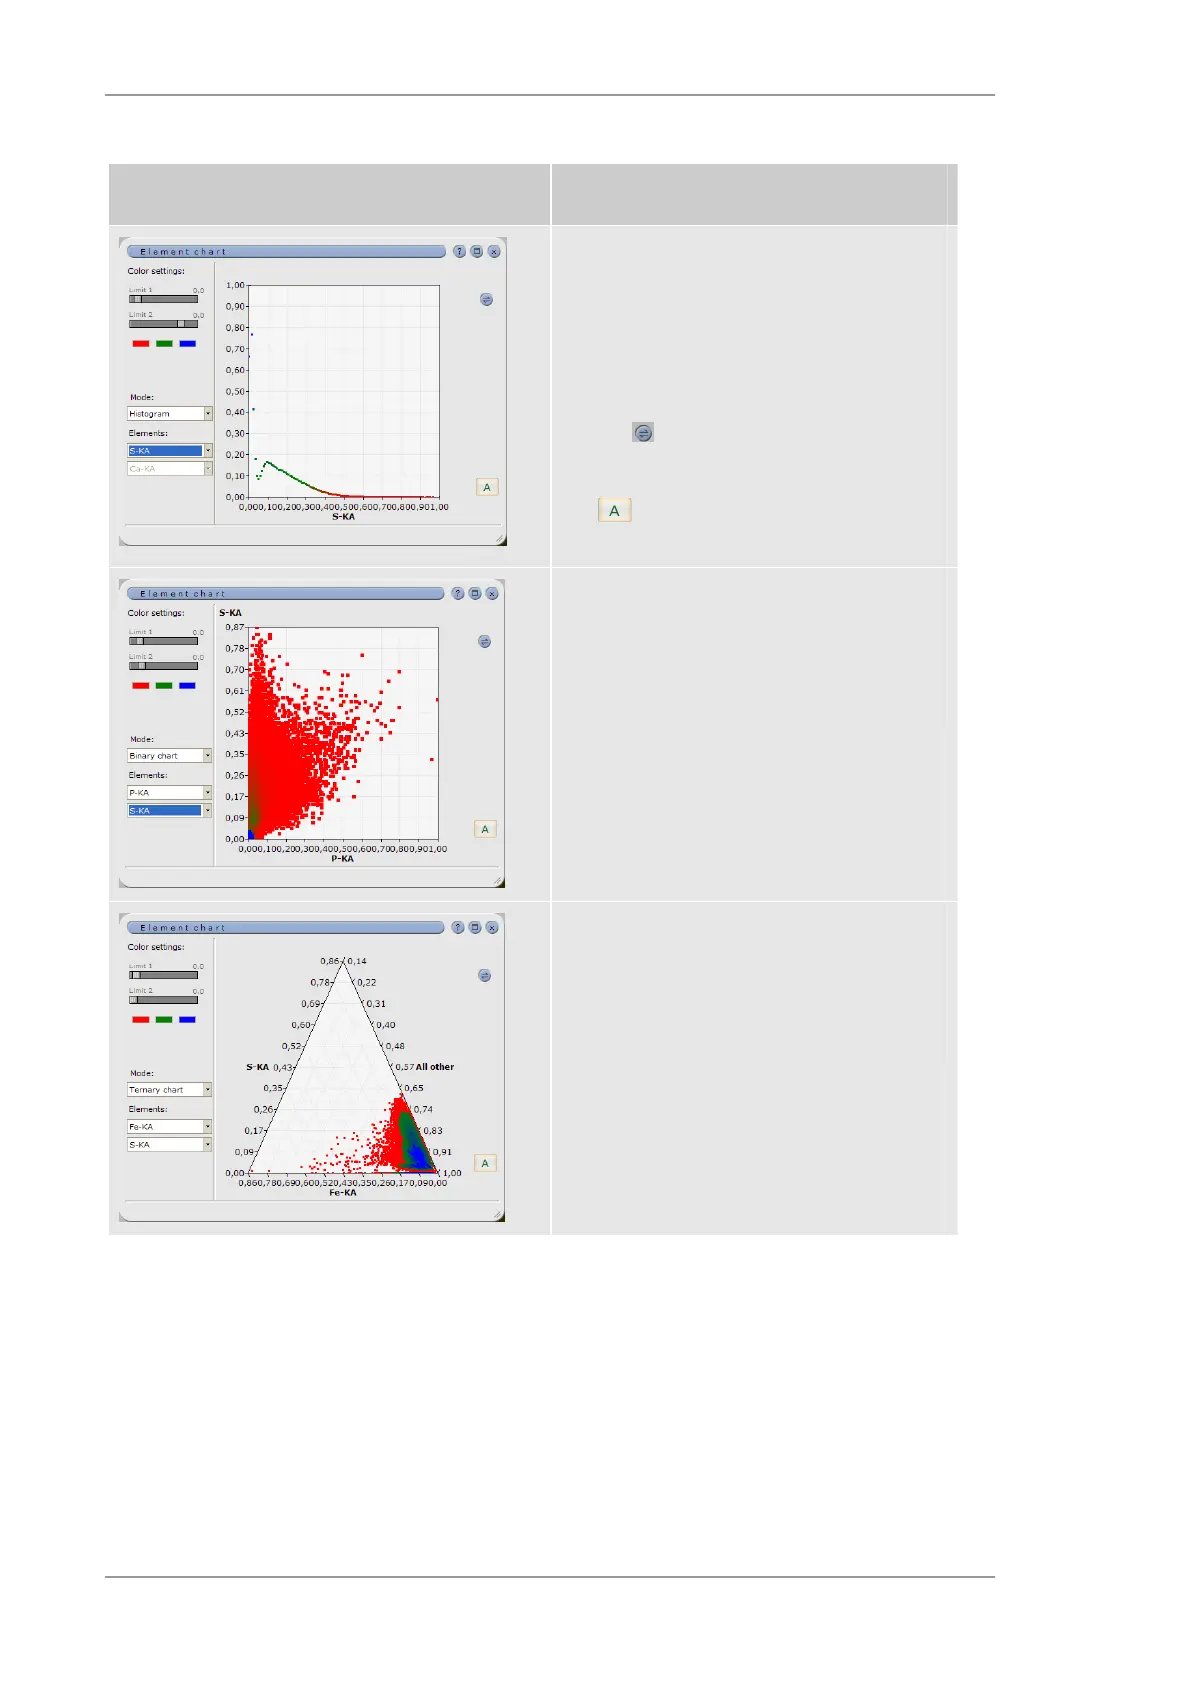
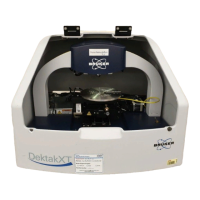
Table 39 Element chart
Type of evaluation Description
The intensity histogram shows the probability
of element intensities in the different pixels.
The considered element can be changed with
the pull down menu. The colouring can be
changed with help of the scroll bars.
With the icon, it is possible to copy or save
the graphic.
The icon allows toggling between full
scale and intensity adjusted scale.
The binary map shows the relation between
similar intensity in different pixels for two
elements. The elements of interest can be
selected in pull down menus, the sensitivity
for colouring with the scroll bars.
The ternary map shows the relation between
two selected elements and all others. The
elements of interest can be selected in pull
down menus, the sensitivity for colouring with
the scroll bars.
6.9.4 The Spectrum tab
The Spectrum tab displays automatically the sum spectrum of the complete mapping.
Furthermore, the sum spectra of defined objects (see section 6.9.3.2) or single pixel spectra are
displayed. They have the same number as the defined object. This number can be changed by
highlighting and typing the new name.