Cellwatch Frontier System Installation & User Manual
Section II – User Guide-70
Discharges (Discharge Data Only)
Select Discharge Event Displays all recorded discharge data for selected event.
Data to Display
Batteries Plot one or more Batteries.
Strings Plot one or more Strings.
Channels Plot one or more Channels.
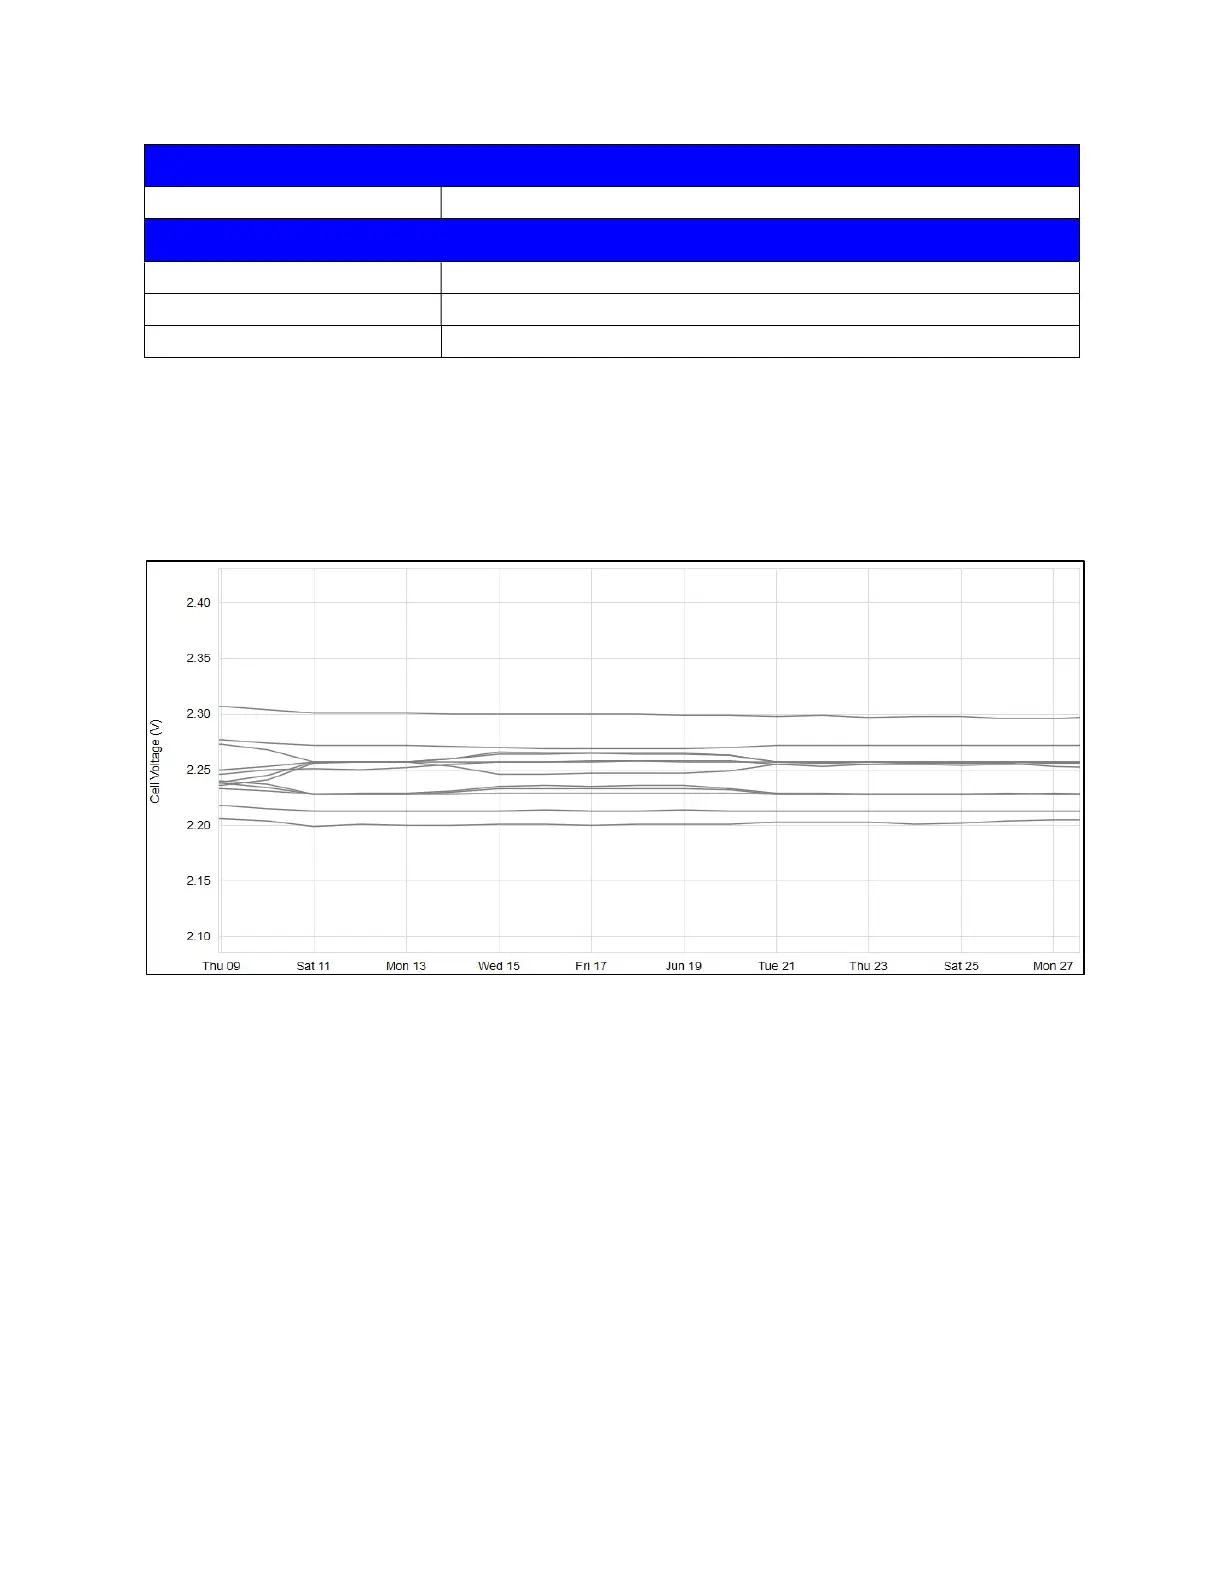
Using the Graphing Functions
When selecting a graph to plot, users will be asked to select the data set they wish to display. Once
selected, an interactive graph will appear allowing the user to click on individual readings for additional
information.
Graph Controls
Zoom: Users can zoom in and out using the Zoom out and Zoom in buttons located below the
graph or by using the scroll wheel on a mouse. Users can also double-click the graph to zoom
into a data point. All zoom functions can be reset using the Reset button at the bottom of the
graph.
Pan: Left-click and hold to pan the graph. Only data from the selected time frame will be
displayed.
Selecting a data plot:
o Left-click plot line: A box will appear providing cell/probe identification information and
allows the user to disable the plot line or color the plot line.
o Left-click cell label below the graph: The plot line will disappear or reappear in the
graph above.
o Right-click cell label below the graph: A box will appear allowing the user to disable the
plot line or color the plot line.