Cellwatch Frontier System Installation & User Manual
Section II – User Guide-69
Previous Page: Go to the previous page of alarms.
Next Page: Go to the next page of alarms.
Last Page: Go to the last page of alarms.
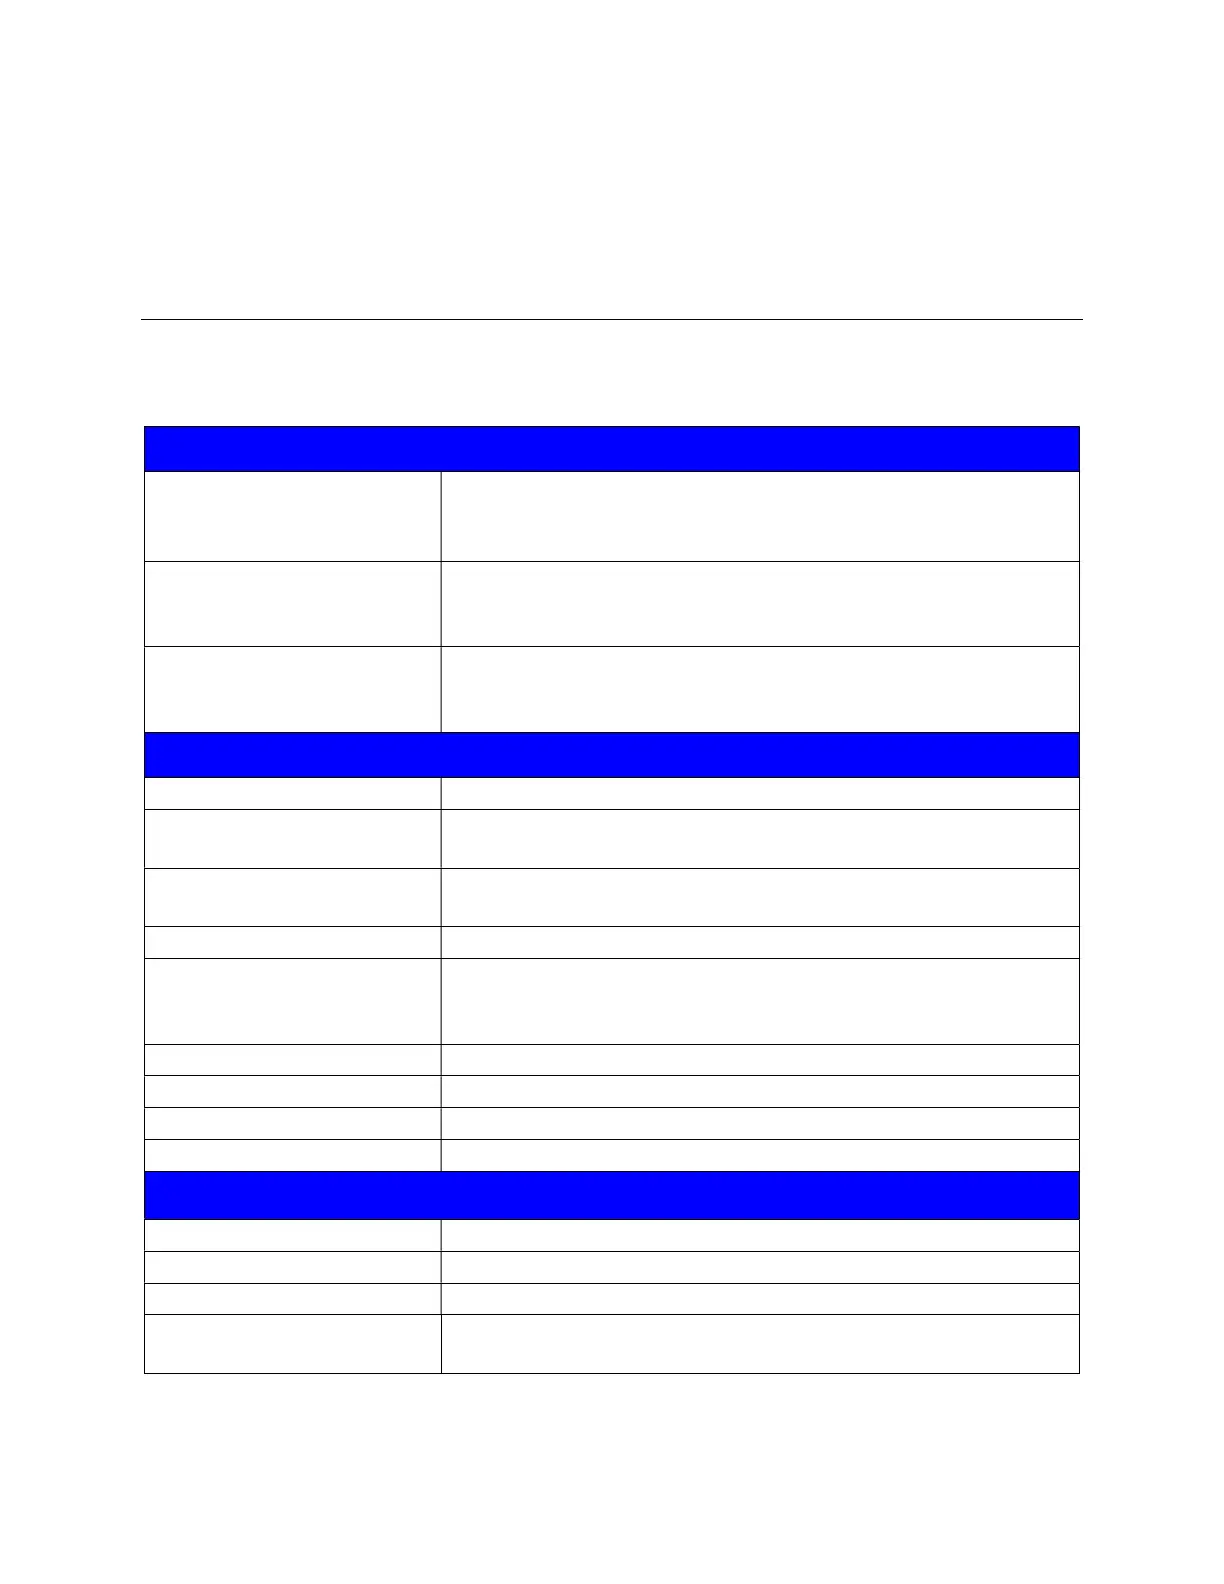
History Graphing
History graphing can be accessed by selecting History on the Navigation Bar. The table below can be
used to help identify the types of graphs that can be displayed.
Data Source
Historical Data
All data collected and stored during non-discharge scans is stored in
an internal database for historical tracking and record keeping. Data
resolution varies as noted below in Timeframe.
Discharge Data
Data is stored at a high-resolution during discharge events to
maintain a record of how individual cells within the battery bank
perform during the event.
Cell Audit (temp comp)
Choose this option if you want to graph the raw uncompensated
ohmic and effective temperatures (when temperature compensated
ohmic is enabled).
Unit
Cell Voltage Plots individual cell voltages.
Channel Ohmic Value
Plots individual cell ohmic values. This will be the compensated
value when temperature compensation is enabled.
Channel Ohmic Value
(uncompensated)
Plots the uncompensated ohmic value data before applying
temperature compensation.
Cell Temperature Plots individual cell temperatures.
Effective Temperature (for
compensation)
Plots the average of the last N temperature readings (depending on
settings). This value is used to calculate the compensated ohmic
values.
String Current Plots available string currents for selected string.
String Voltage Plots string voltage for the selected string.
String Ripple Plots string ripple voltage for the selected string.
Temperature Plots available probe temperatures for the selected string.
Timeframe (History Data Only)
Day Display selected data for the day up to 15-minute intervals.
Month Display selected data for the month in one day intervals.
Year Display selected data for the year up in one day intervals.
Custom
Select the Start and End dates to plot data. The measurements will
appear in one day intervals.