The data area, which displays all the values measured by the device.
The units and status area, which displays the different statuses, units and device information
(Table 15).
Table 15:Display icons.
Icon Description Icon Description
Analyzer profile.
Analog bar, where the % of the current
power of the installation is shown.
Electrical energy efficiency
profile, e
3
.
Quadrant in which the device is working.
User profile.
cos φ or the power factor of the instal-
lation.
Maximum demand. Consumption.
Maximum value. Generation.
Minimum value. Digital input connected.
Configuration menu protected
by password.
Relay disconnected or connected.
Screen in edit mode in the con-
figuration menu.
Digital output connected.
Active RS-485 communica-
tions.
T1, T2, T3
Active tariff.
4.2.1.- cos φ - PF (POWER FACTOR
Figure 31: Cos φ - PF.
This bar displays the value of the installation’s cos φ or Power Factor (PF) in real time. The parameter
that will be displayed is selected on the programming menu. (“6.16.- DISPLAY SELECTING Cos φ - PF”).
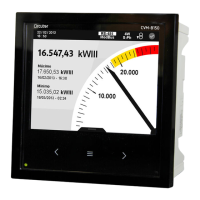
4.2.2.- ANALOGUE BAR
Figure 32: Analogue Bar
The current power of the installation in % is displayed on the analog bar. When the value exceeds
110% the analog bar flashes. And if the value exceeds 999% -Hiis displayed.
43
Instruction Manual
CVM-C11