D-Link DWC-2000 User Manual 195
Section 7 - Viewing Status and Statistics
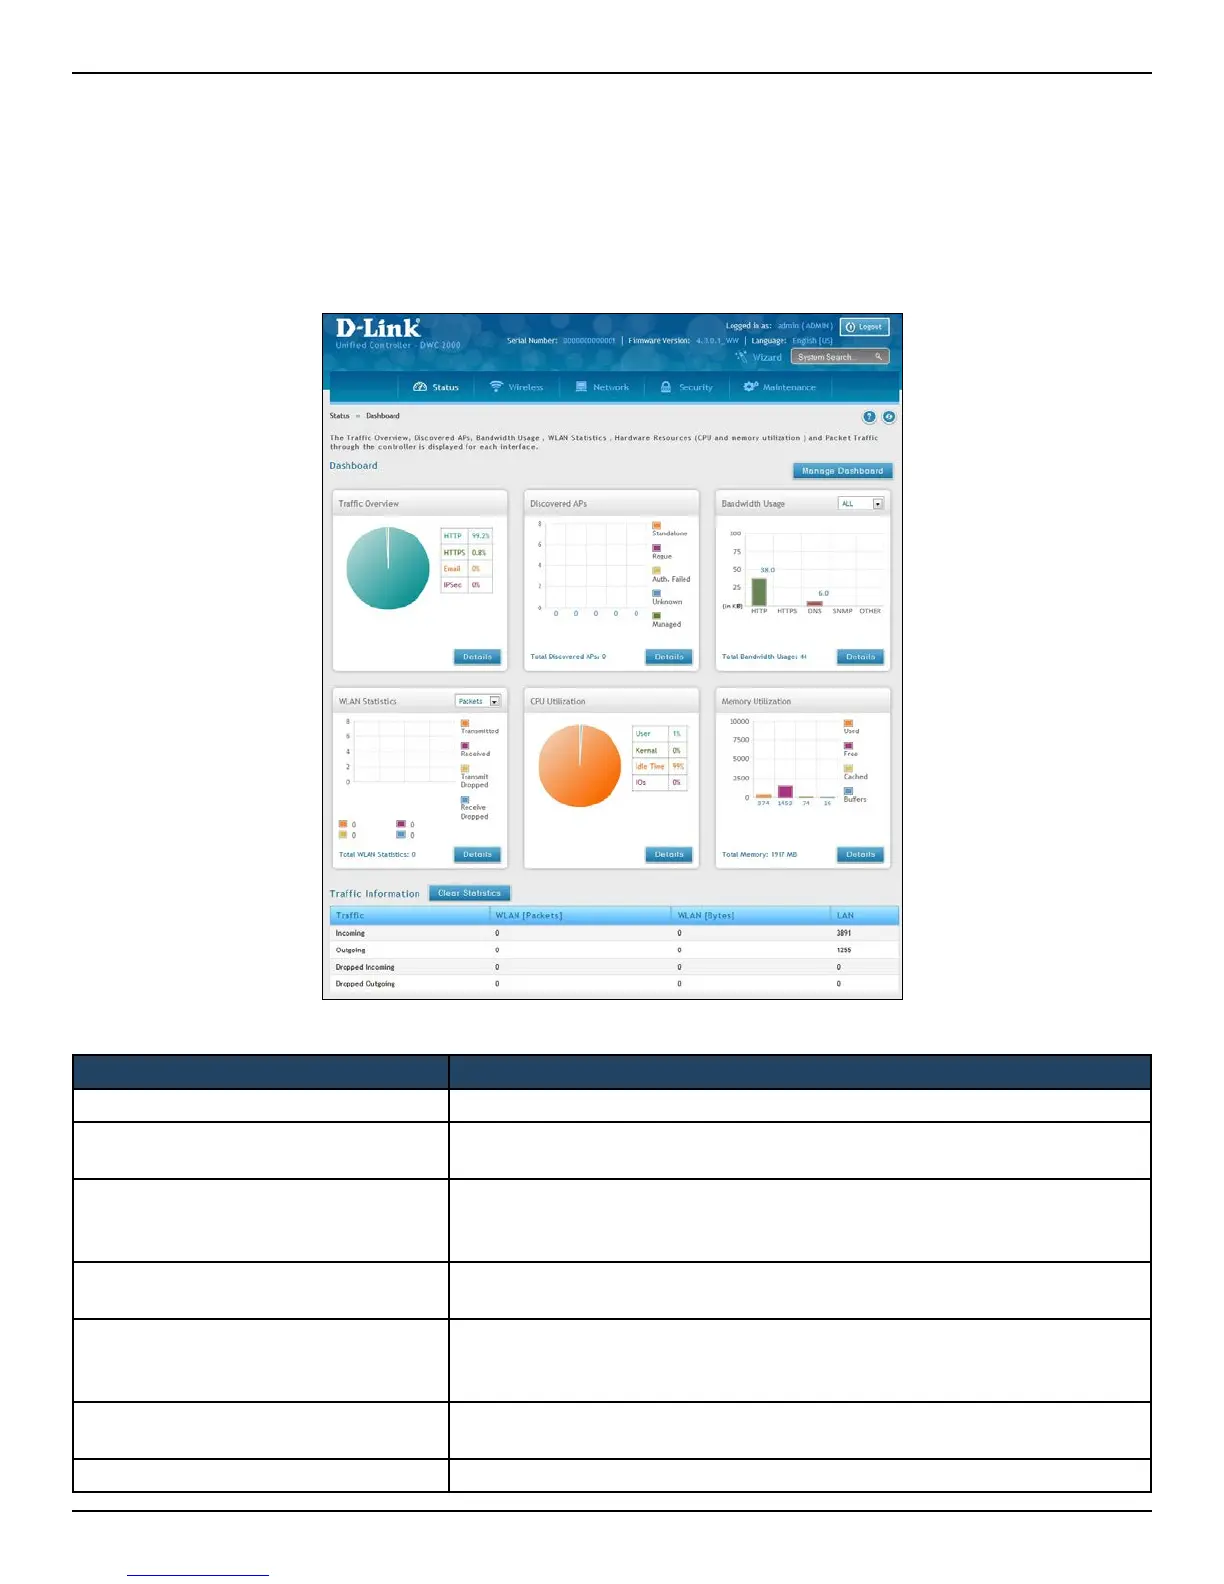
Viewing Statistic and Utilization
Path: Status > Dashboard
The wireless controller provides a dashboard that displays about the resources the system is using . The dashboard
page is organized into the following sections:
Section Description
Trac Overview Displays a chart of trac overview by service for each interface.
Discovered APs
Displays a chart of discovered Apps by their current status as detected by the
DWC-2000.
Bandwidth Usage
Displays bandwidth usage by network segment such as WLAN or LAN. The
data is broken into by applications service such as HTTP, HTTPS, DNS, SNMP,
and others.
WLAN Statistics
Displays a chart of trac overview by bandwidth and packet information for
WLAN trac captured by all of the managed APs currently associated.
CPU Utilization
Percent of the CPU utilization currently consumed by the device. The CPU
utilization is broken down into specics such as all user space processes, such
as management operations, kernel space processes, and CPU idle time or IO.
Memory Utilization
Displays a breakdown of memory usage by the amount used, free, cached,
and currently in the system buer.
Trac Information Displays a grid of trac statistics for each interface.