Image Optimization 5-3
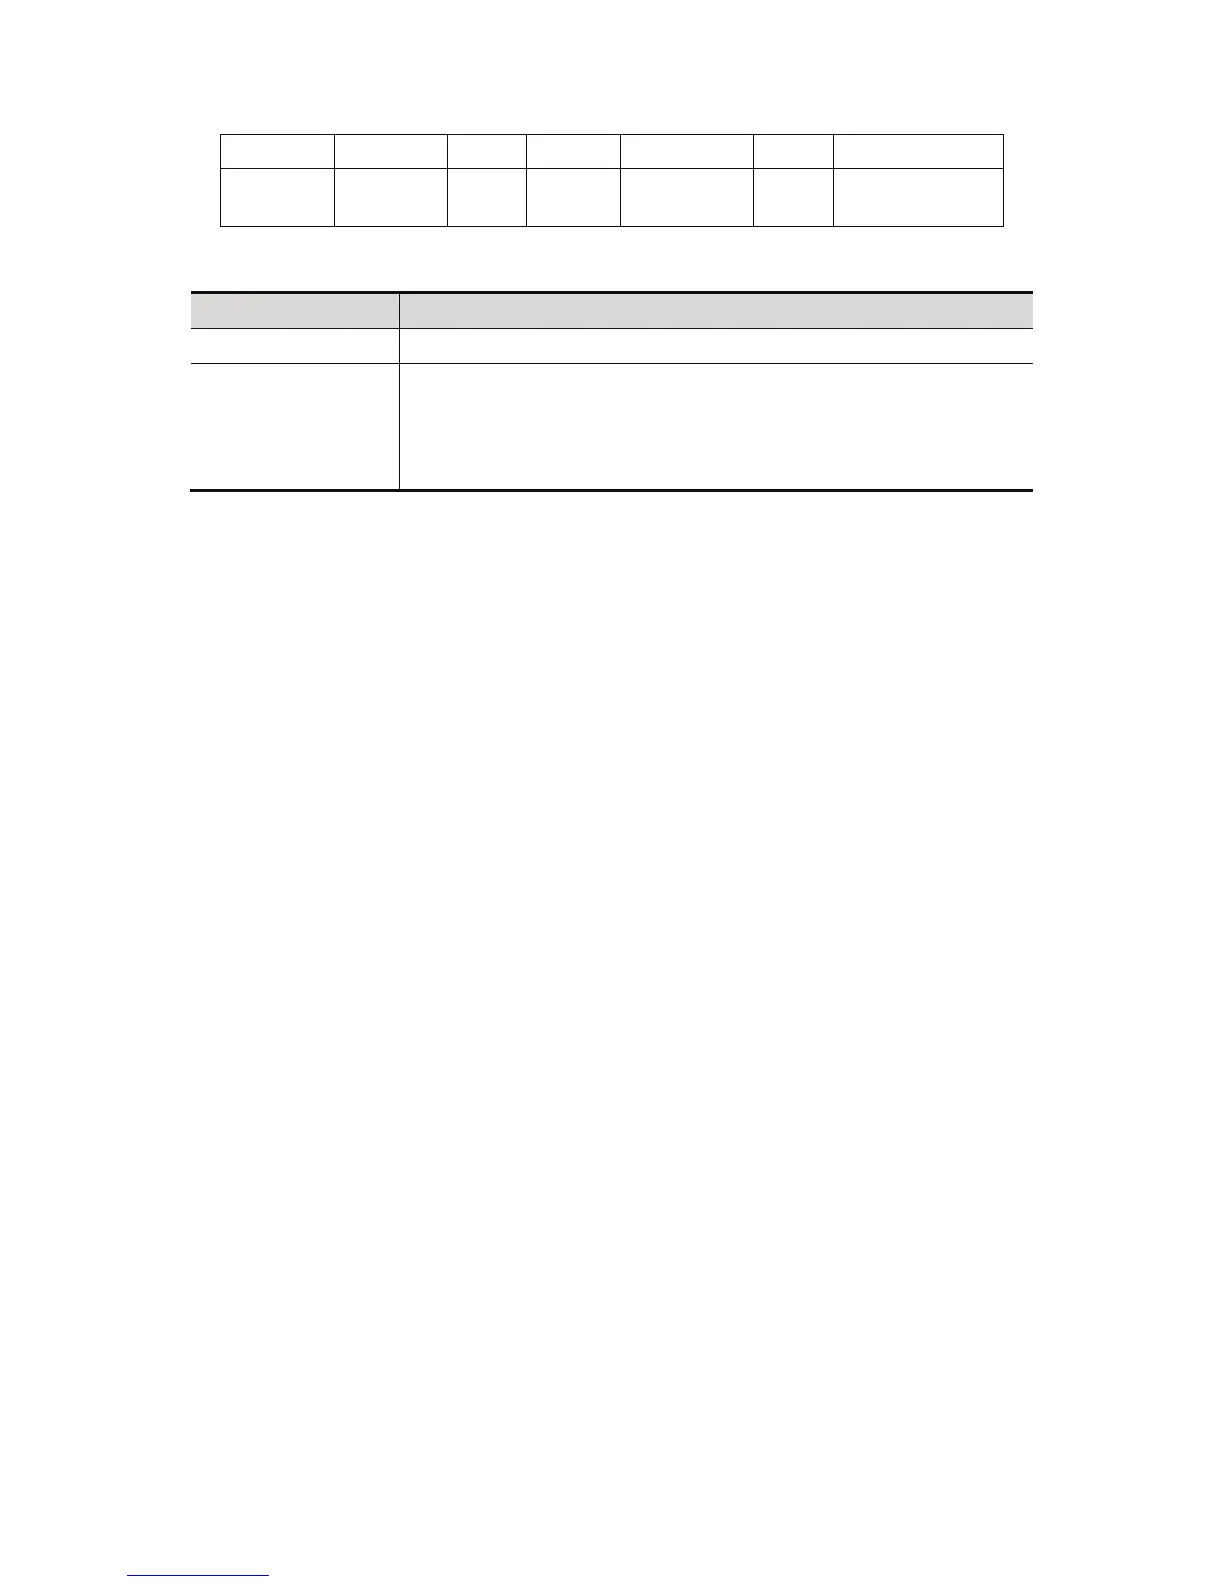
Display F 2.5M D 21.3 G 100 FR 34 IP 1 DR 65
Parameter Frequency Depth Gain Frame Rate B IP B Dynamic
Range
Parameters that can be adjusted to optimize the B Mode image are indicated in the following.
Adjustment Items
Control Panel Gain, Depth, TGC, iTouch, Focus, Frequency, Dual, Quad
Menu
Frequency, iBeam, Gray Map, Focus Position, Focus Number,
Colorize, Colorize Map, FOV, IP, Dyn Range, Persistence, L/R Flip,
U/D Flip, Line Density, iTouch, Acoustic power, Smooth, High FR, TSI,
FOV Position, Rotation, HScale, Lithotrity, Gray Rejection, Ȗ, Curve,
Gray Invert
5.3.3 B Mode Image Optimization
Gain
Description To adjust the gain of the whole receiving information in B mode. The real-time
gain value is displayed in the image parameter area in the upper left corner of
the screen.
Operation Rotate the <Gain/iTouch> knob clockwise to increase the gain, and
anticlockwise to decrease.
Or adjust it in the image parameter area.
The adjusting range is 0-100.
Effects Increasing the gain will brighten the image and you can see more received
signals. However, noise may also be increased.
Depth
Description This function is used to adjust the display depth of sampling, the real-time
value of which is displayed on the image parameter area in the upper left
corner of the screen.
Operation Use the <Depth/Zoom> knob to adjust the depth;
Or adjust it in the image parameter area.
The adjustable depth values vary depending upon the probe types.
Effects Increase the depth to see tissue in deeper locations, while decrease the depth
to see tissue in shallower locations.
Impacts Depth increase will cause a decrease in the frame rate.
TGC
Description The system compensates the signals from deeper tissue by segments to
optimize the image.
There are 8-segment TGC sliders on the control panel corresponding to the
areas in the image.