SpectroEye™ 41
2
2 • Use
2.4.1.4 Graphic representation of measurement results
The graphic representation may be very useful to correctly
interpret the measurement results. To change between numerical
and graphical display you can use the Graphical/Numerical
icons on the symbol bar. The SpectroEye may represent both
absolute values and differences in graphical mode.
For the CIELAB function the various graphic representation
possibilities are as follows:
• Graphic representation of absolute measurement values
In numerical mode, using the absolute difference icon, first
select the absolute representation, then switch to graphic
representation using the Graphical/Numerical icon.
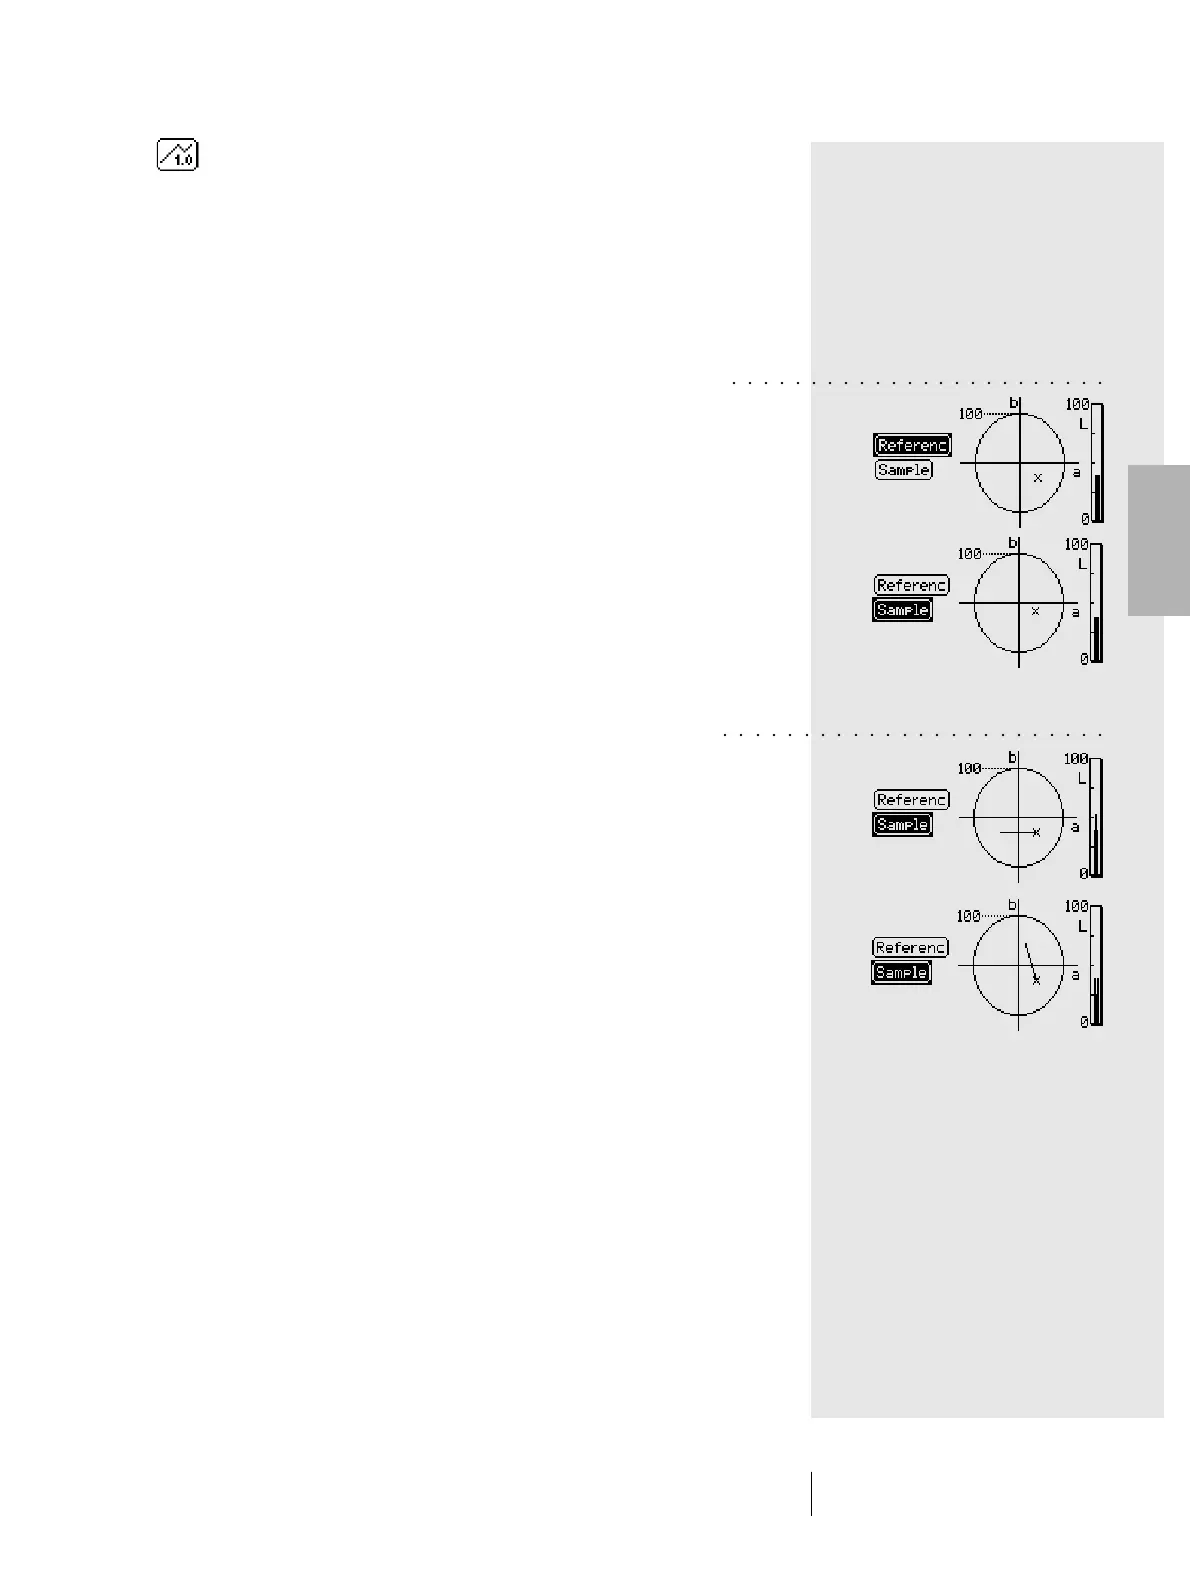
The graphical representation of CIELAB values shows the
CIELAB system with the green-red axis (a), the yellow-blue
axis (b) and a saturation ring with unit 100. The (x) mark inside
the representation shows the position of the measured value.
The third dimension of the CIELAB system, i.e. the brightness,
is the represented by the vertical bar on the right side of
display. The brightness value can be read according to the
length of the black bar.
• Graphic representation of the color difference between
reference and sample
Using the Absolute/Difference icon, select the Difference
option for the sample.
The cross mark (x) indicates the position of the reference
item, while the line indicates the direction where the sample
diverges from the reference itself. The length of the line is
always the same i.e. it does not represent a distance between
the measurement values. In the brightness display, the
brightness of the reference is represented by the thick black
bar. If the sample is lighter than the reference, this is repre-
sented by a thinner line above the thicker one (see the top
figure). If the sample is darker than the reference, a thin light
line is shown inside the thicker black line (see the bottom
figure). This line also will always have the same length,
so it can only be used to detect the direction.
○○○○○○○○○○○○○○○○○○○○○○○○
○○○○○○○○○○○○○○○○○○○○○○○○