SpectroEye™26
2
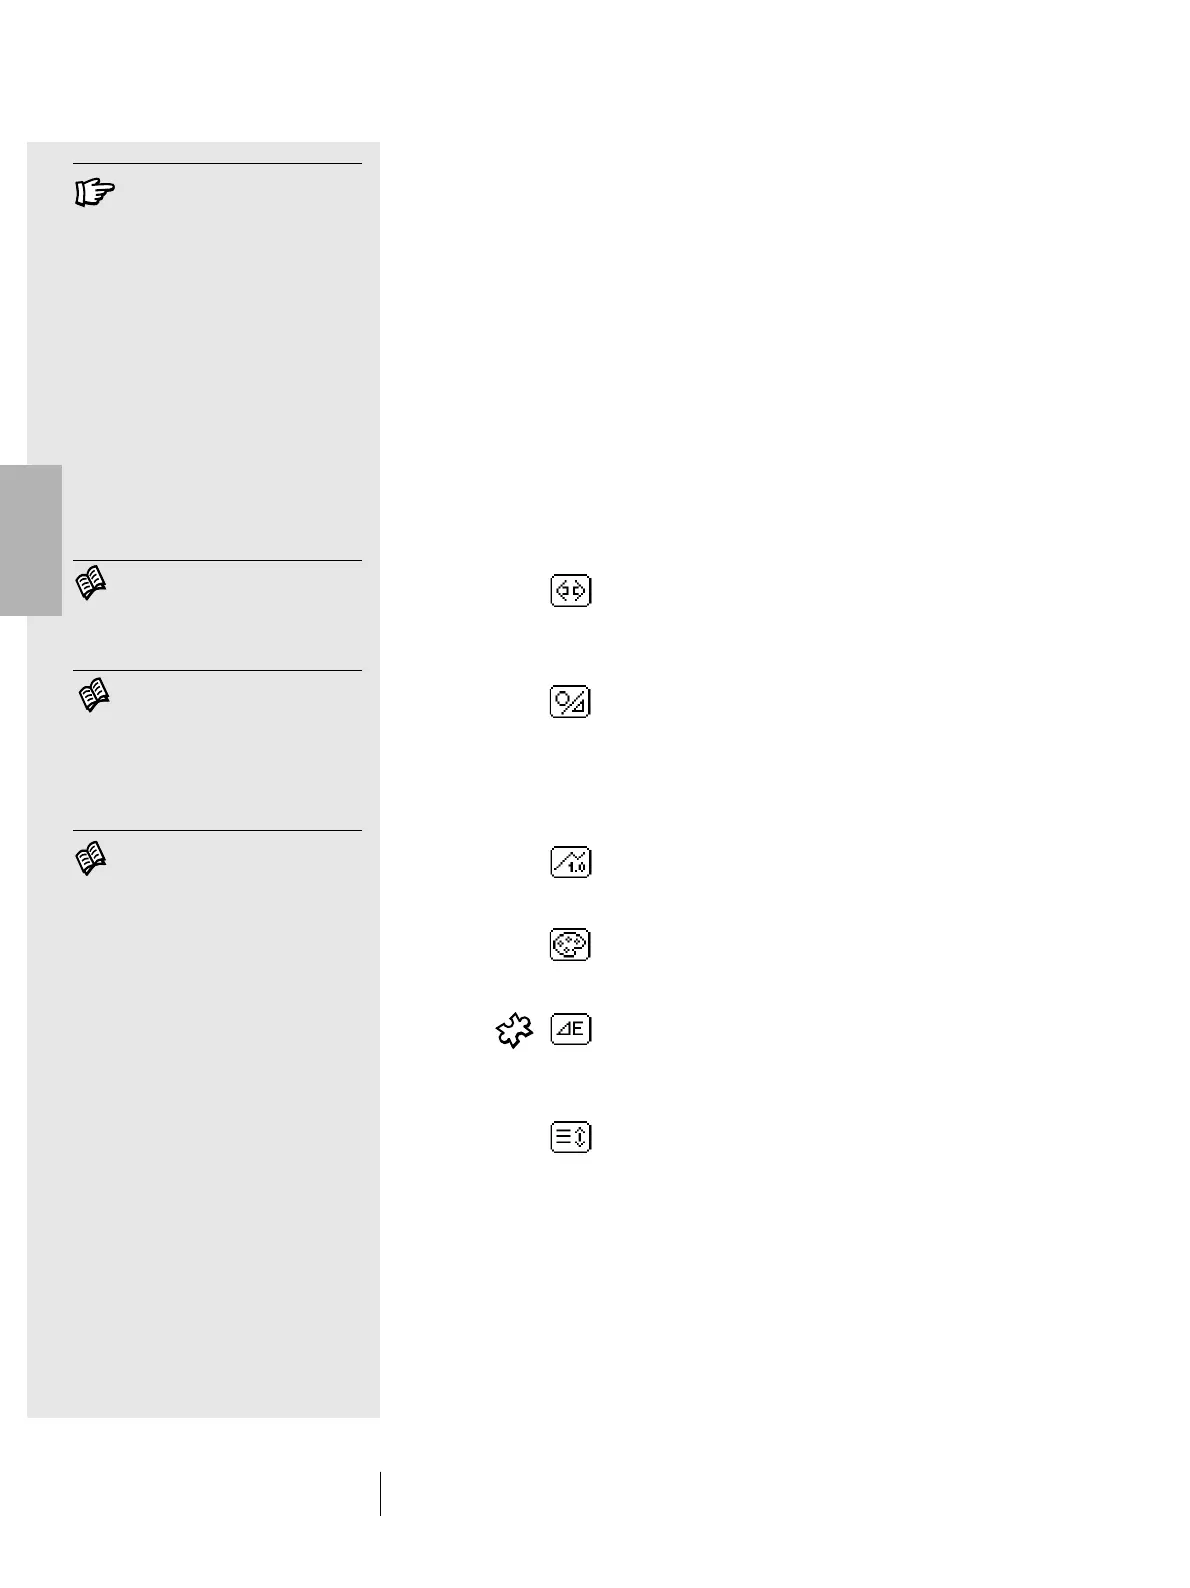
2.2.2.2 The symbols bar
The symbols bar contains the various selectable icons.
One or more icons illustrated below may not appear in the bar
for various reasons. One of these reasons is that only the icons
actually required for the selected measurement are displayed.
For example if a spectrum measurement function is selected,
the density filter icon will not appear. There are also certain icons
for optional functions which may not be installed on the
SpectroEye. These icons are only available if the optional
function has been purchased and installed. In the following
overview, these are distinguished by the puzzle symbol.
Function icons are subdivided into four groups:
1. Icons for display modification
These icons simply serve to switch the given display.
The measured values are maintained.
Measurement function
Selecting this icon modifies the measurement mode.
In this way you can switch between colorimetric and
density functions.
Absolute / Difference
If the Absolute / Difference icon is selected after
having measured the reference and the sample,
the display always switches between the absolute
value measured for the sample and the difference
between the reference and sample.
Numerical / Graphical
Use this to switch between graphical and numerical
displays of measurement values.
Filter Density
In density measurement you can choose between
manual and automatic filter selection.
E Formula
In spectral measurement, the color differences can
be calculated using different formulas. This icon
permits selection of the desired formula from the list.
Scroll
This icon is necessary if numerical representation
has been selected for reflection or density spectra.
In this case it is not possible to display all the
measurement values in a single window. Select this
icon to scroll through the list of measurement values.
2 • Use
The function of the icons is
illustrated in detail in the corres-
ponding points of chapter 2.4.
Read chapter 2.4.1.6
Read chapter 2.4.1.3
Read chapter 2.4.1.4