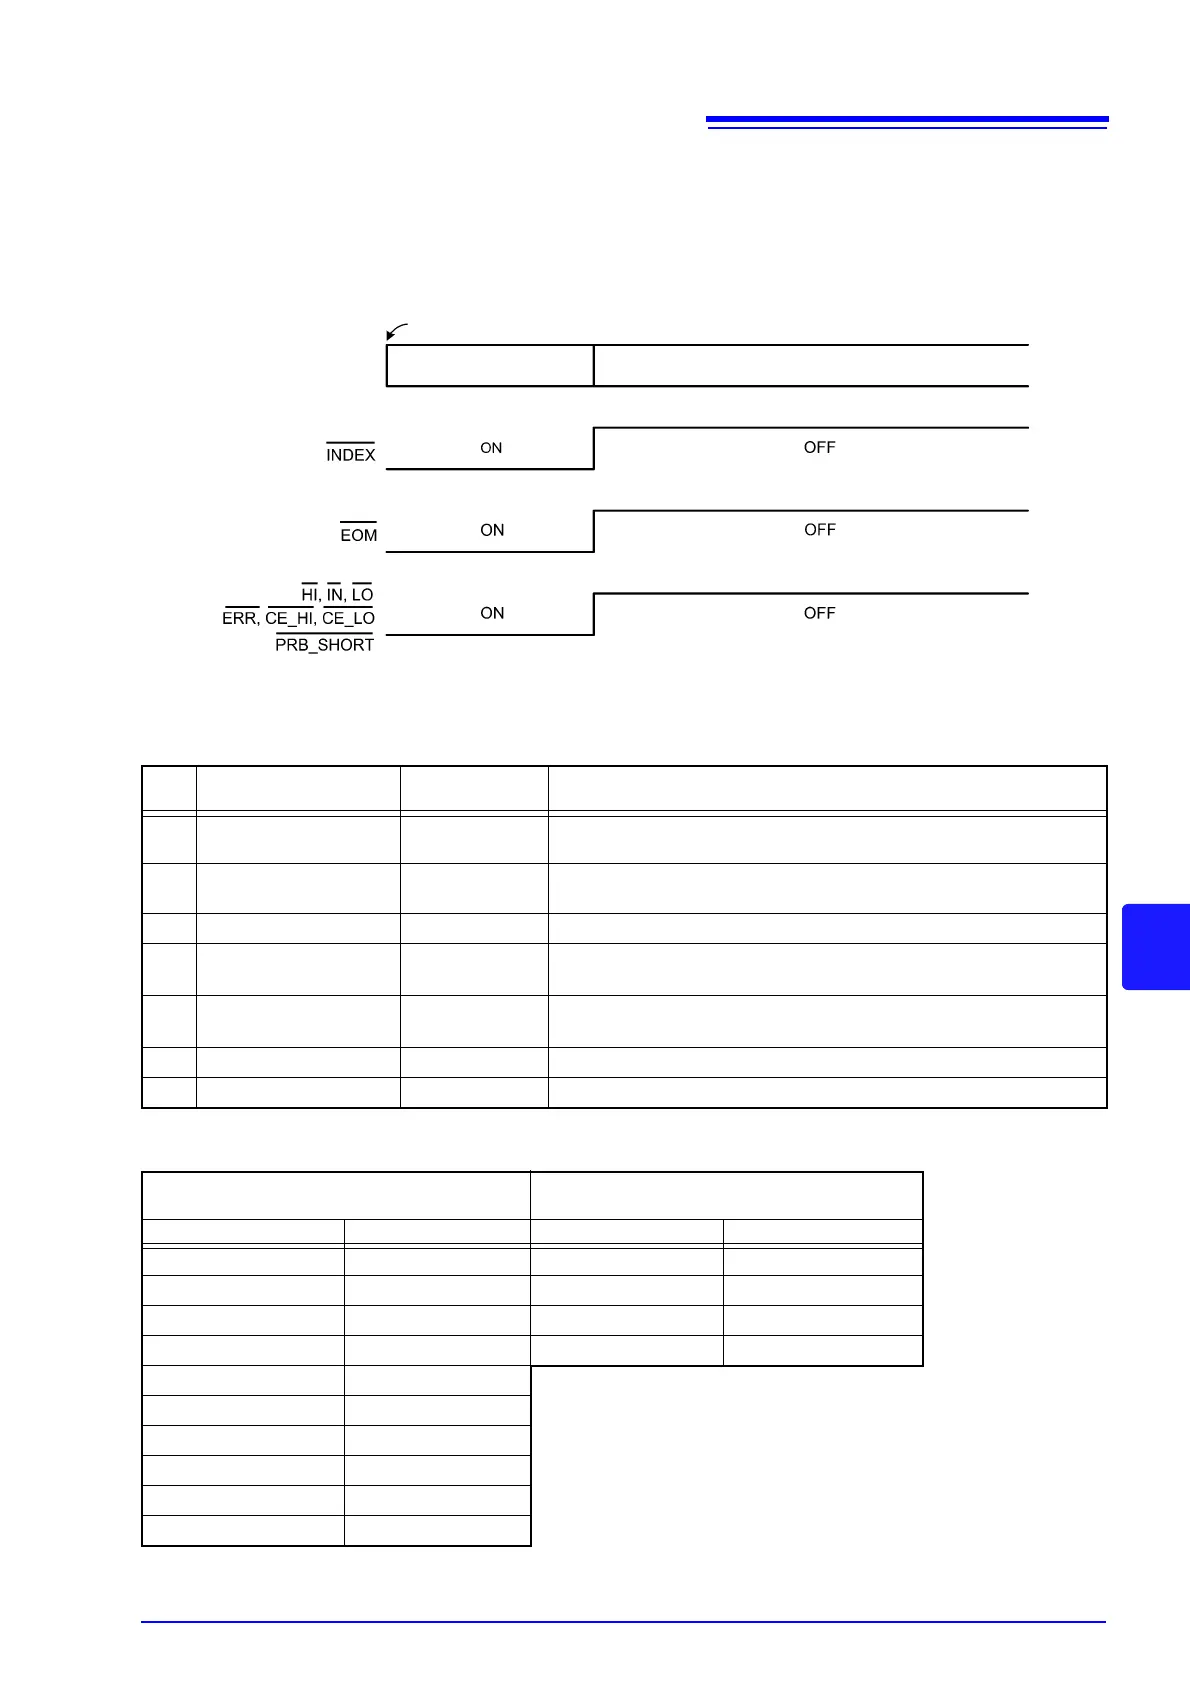
8.2 Timing Chart
89
8
Timing Chart Interval Descriptions
Inter-
val
Description Duration Remarks
t0
Trigger Pulse
Asserted (ON)
0.1 ms or more Falling (ON)-/rising (OFF)-edge selectable
t1
Trigger Pulse
De-asserted (OFF)
0.1 ms or more
t2 Delay 1 0 to 100 ms Setting-dependent
t3 Delay 2 0 to 100 ms
Setting-dependent (When the Contact Improver function is set to
Pulse, 0.1 ms is added.)
t4 Measurement time 0.1 to 100 ms
OVC OFF: Integration Time + Internal Delay (see following table)
OVC ON: (Integration Time + Internal Delay)
× 2 + Delay2
t5 Calculation time 0.1 ms Calculation time is longer when memory storage is enabled.
t6 EOM pulse width 1 to 100 ms Setting-dependent
Internal Delay
Resistance Measurement
(LOW POWER OFF)
Low Power Resistance Measurement
(LOW POWER ON)
Range Internal Delay [ms] Range Internal Delay [ms]
100m 1.4 1000m 0.8
1000m 0.7 10 0.8
10 0.5 100 0.6
100 0.5 1000 3.3
1000 0.5
Total processing time before and after integra-
tion measurements
10k 0.5
100k 0.7
1000k 0.8
10M 2.6
100M 5.3
Output Signal State at Power-On
All signals are low (asserted active-low) when power is turned on.
All output signals become high (de-asserted active-low) when changing from the
initial screen to the Measurement screen.
Operation is shown when the trigger source is set to external triggering (EXT).
Instrument
State
Power-On
Initial Screen Measurement Screen