58
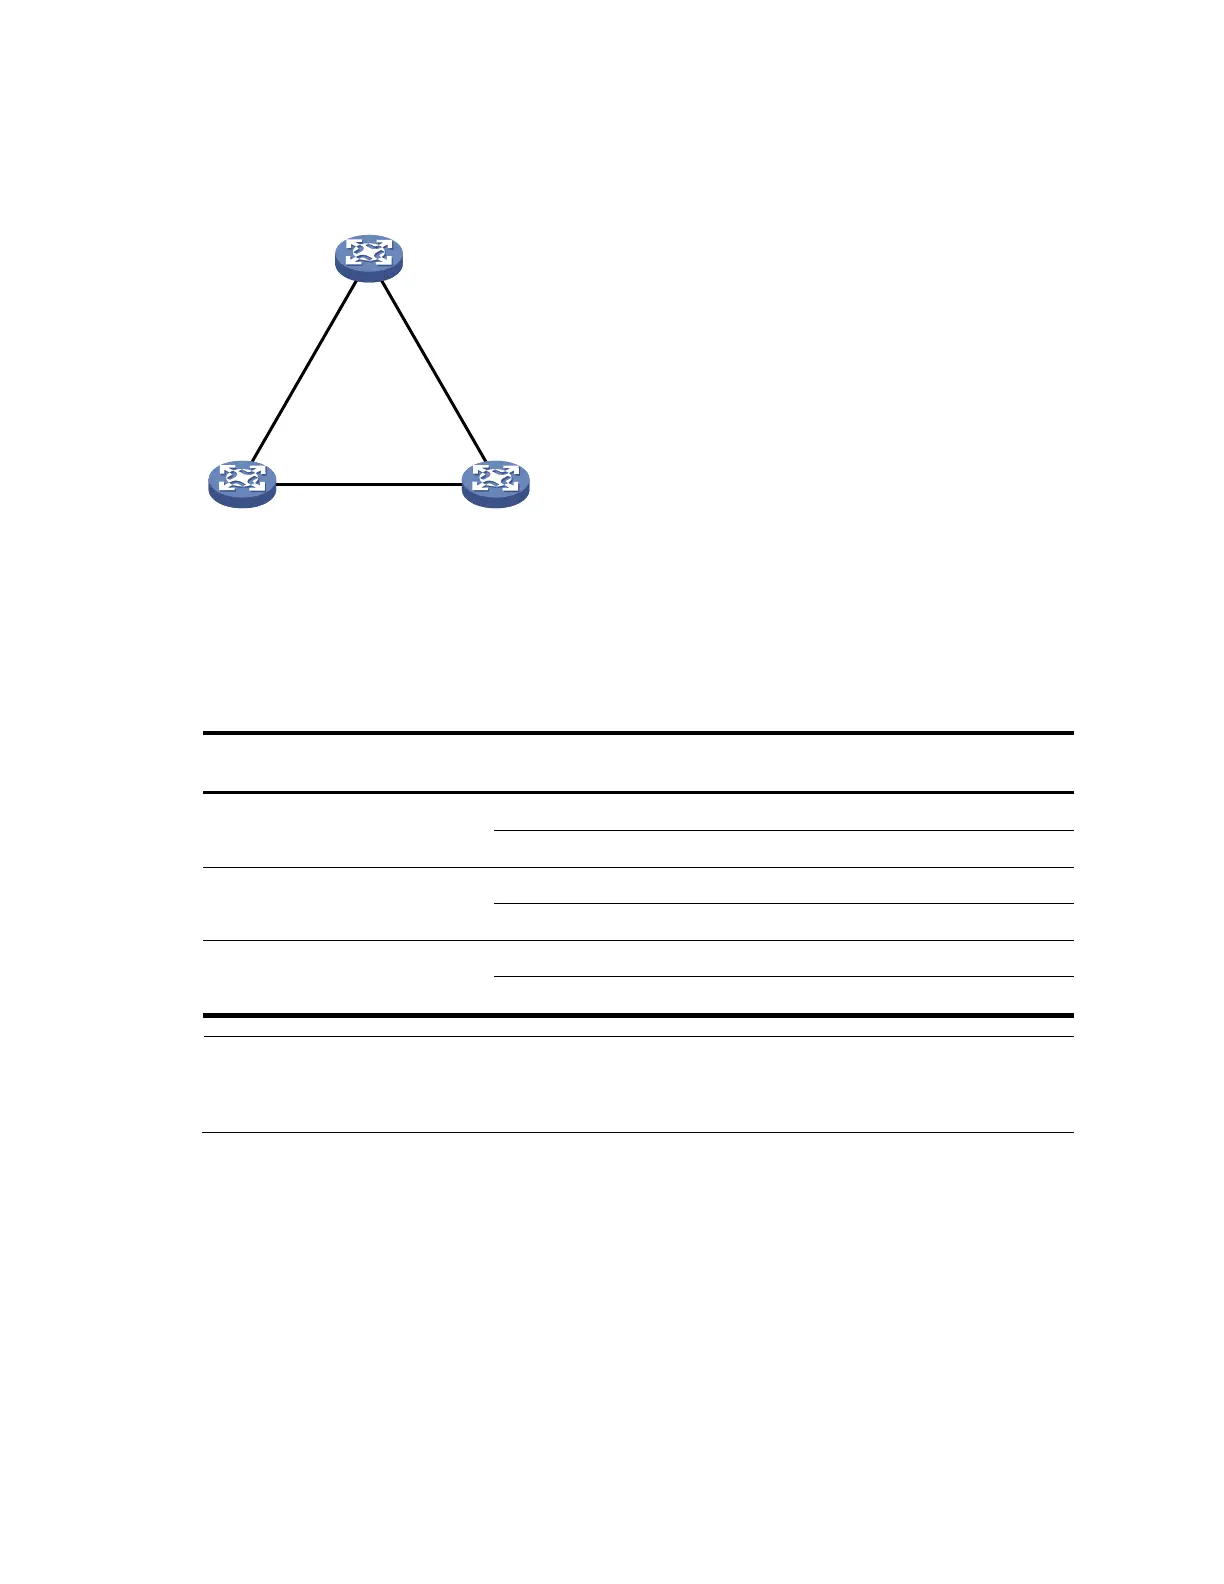
Figure 16 provides an example of how the STP algorithm works.
Figure 16 Network diagram for the STP algorithm
Device A
Priority = 0
Device B
Priority = 1
Device C
Priority = 2
Port A1 Port A2
Port B1
Port B2
Port C1
Port C2
P
ath cost
=
5
P
ath cost
=
10
Path cost = 4
As shown in Figure 16, the priority of Device A, Device B, and Device C is 0, 1, and 2 respectively, and
the path costs among these links are 5, 10, and 4 respectively.
4. Initial state of each device
Table 10 Initial state of each device
Configuration BPDU on the
port
NOTE:
In Table 10, each configuration BPDU contains the following fields: root bridge ID, root path cost,
designated bridge ID, and designated port ID.
5. Comparison process and result on each device
 Loading...