0.5 2
1 4
2 (L2) 8
5 (L5) 20
10 (L10) 40
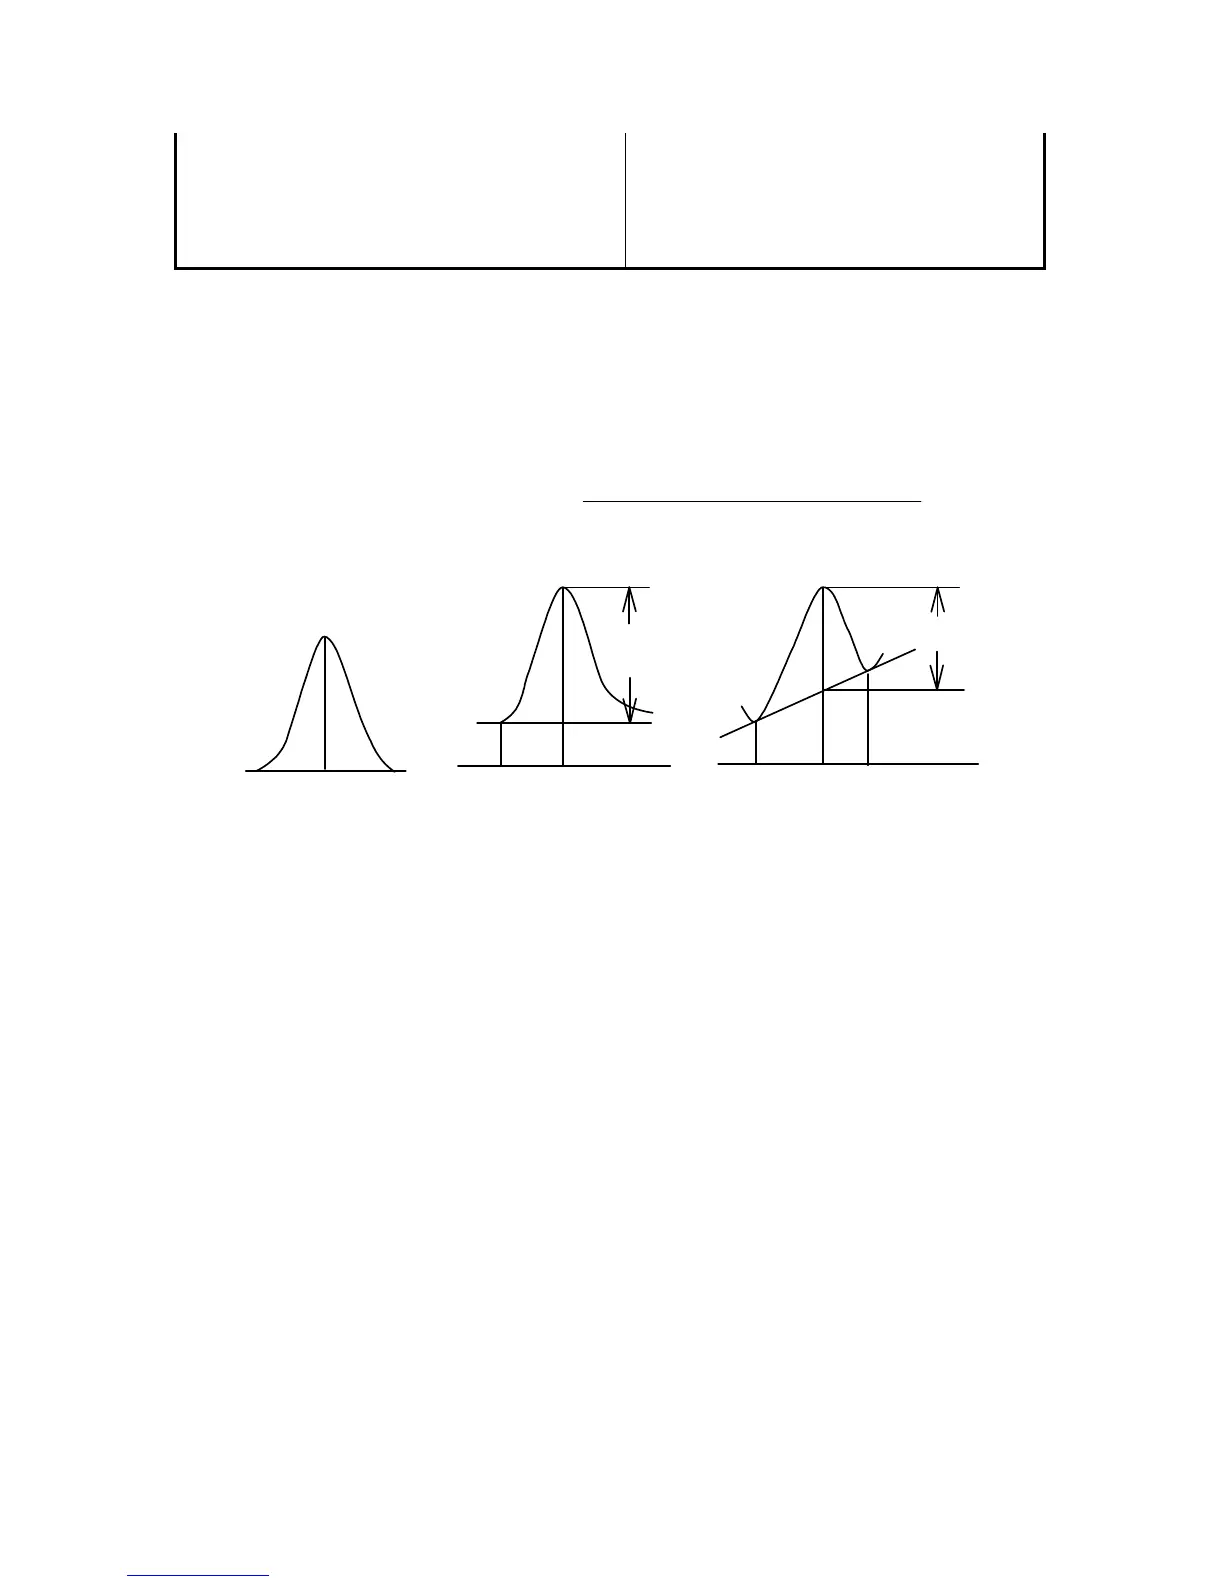
[M ethod] N o. of w avelengths used in quantitative analysis. S elects optim um
num ber. of w avelengths (1, 2, or 3) according to the sam ple condition.
1-w avelength: F or com m on solution sam ple. S ee Fig. 4.13 (1).
2-w avelength: F or baseline correction. S ee Fig. 4.13 (2).
3-w avelength: F or baseline correction. S ee Fig. 4.13 (3).
In [3-w avelength], the absorbance value is obtained from the follow ing
equation:
DAbs E
3 2
WL 1 WL 1WL 2
D Abs
D Abs
WL 1WL 2 WL 3
E(2)
E(1)
E(3)
(1) (2) (3)
1-wavelength
2-wavelength 3-wavelength
(Peak) (Base 1) (Peak) (Peak)(Base 1) (Base2)
F igure 4.12 Q uantitative analysis m ethod according to num ber of w avelengths.
[P eak] P eak w avelength
[B ase 1] B ase 1 w avelength
[B ase 2] B ase 2 w avelength
T he input range varies according to the m odel.
V -530: 190.0 to 1100.0 nm
V -550/560: 190.0 to 900.0 nm
V -570: 190.0 to 2500.0 nm
[S am ple N o.] S ets the sam ple num ber for m easurem ent. S am ple num ber increases
increm entally by one w ith each subsequent m easurem ent.
[N o. of C ycle] S ets how m any tim es each sam ple is m easured. If 2 or m ore
m easurem ents are set, the [C ycle Tim e] field appears.
[C ycle Tim e] S ets the tim e in seconds betw een m easurem ents. If the cycle tim e is
shorter than the m easurem ent tim e, the next m easurem ent starts
im m ediately.
Input range: 0 to 15000 sec.
<O K > T ransfers the m easurem ent param eters to the spectrophotom eter. T he
[C alibrate C urve P aram eters] dialog box appears.