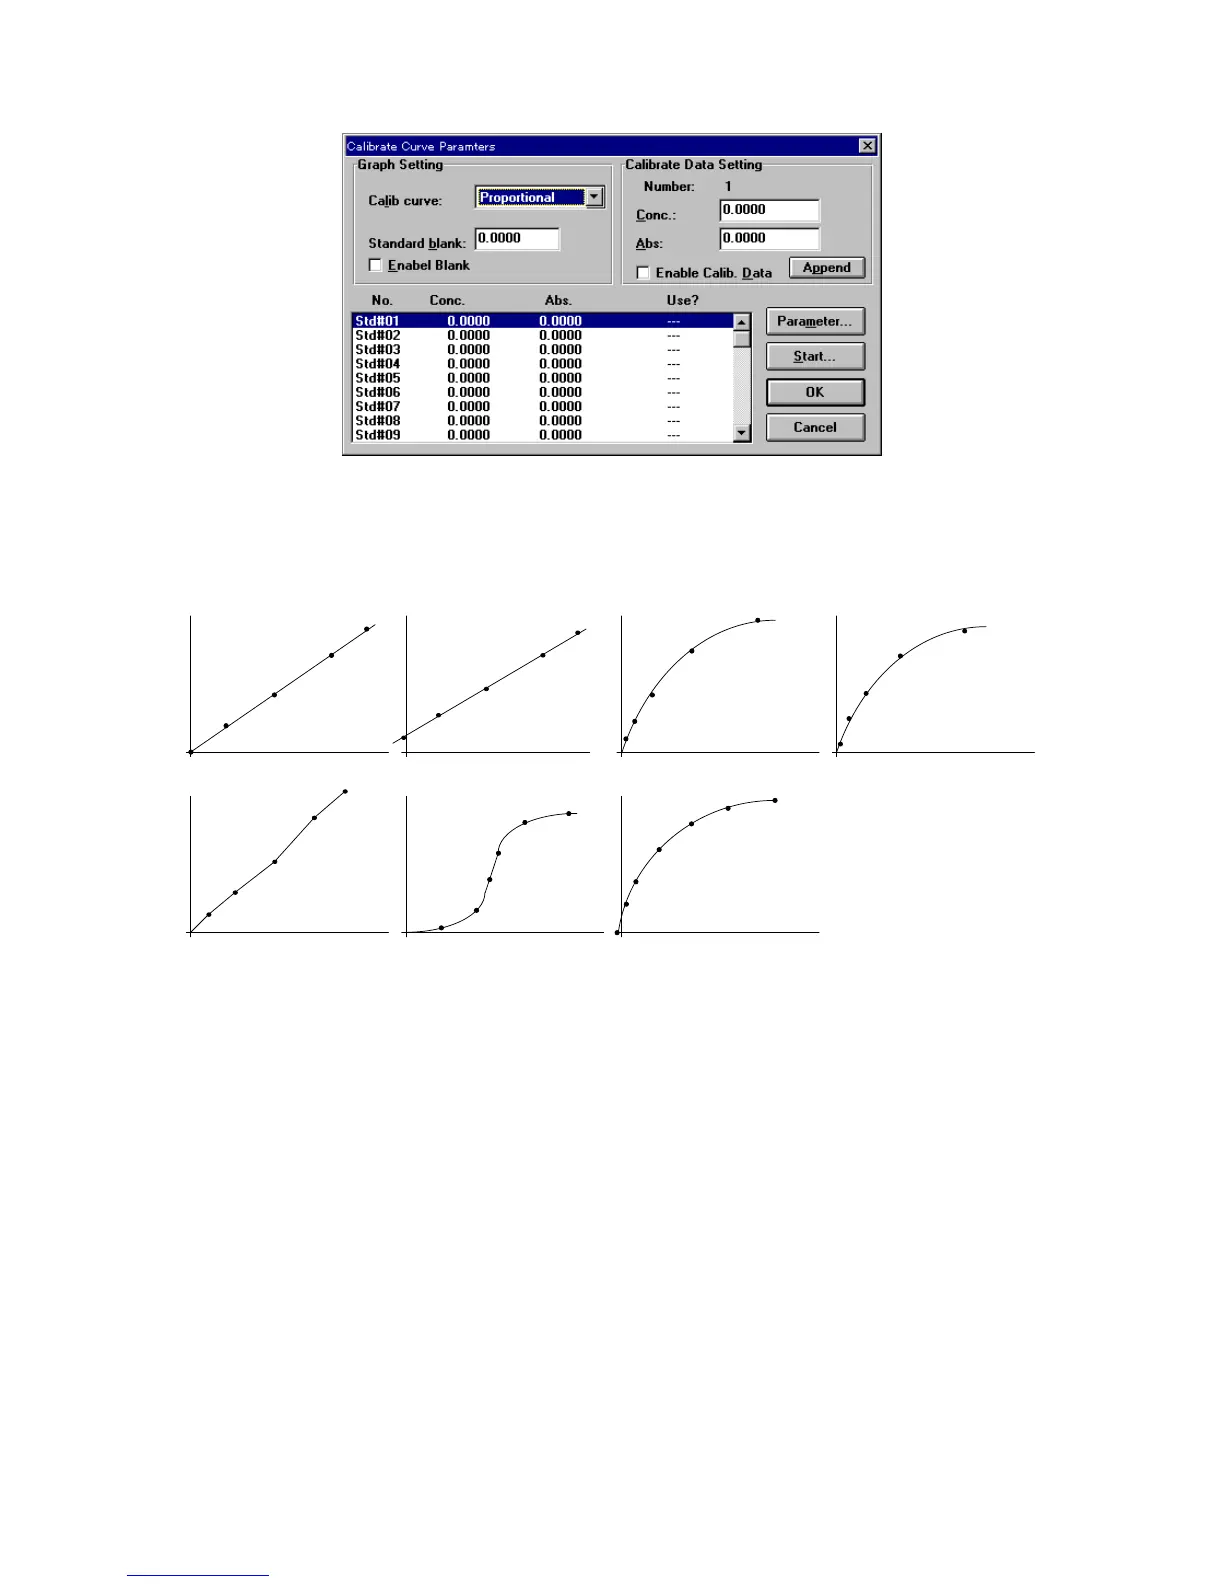
F igure 4.13 [C alibrate C urve P aram eters] dialog box
[G raph S etting]
[C alib C urve] T he type of calibration curve. C lick the drop-dow n form at box and select a
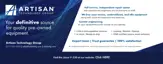
type. F ig. 4.15 show s the nam es of m odes and types of graphs.
Segmented line Logistic function
Spline function
Proportional expression
Linear expression Quadratic expression
Third-order expression
F igure 4.14
[S tandard B lank] If the standard blank value is know n, select the [E nable B lank] checkbox
by entering the value. If the standard blank is unknow n, a value does not
need to be input, because the standard blank can be m easured later from
the [Q uantitative M easurem ent] dialog box.
[E nable B lank] S elect the [E nable B lank] checkbox w hen the standard blank value is
input. A check is autom atically appended w hen the standard blank is
m easured.
[C alibrate D ata S etting]
[N um ber] Indicates the standard sam ple num ber. The displayed num ber reflects the
selected standard sam ple from the standard data display field. T he
concentration and absorbance of the selected standard sam ple can be input.
[C onc.] T ext box for inputting the standard sam ple concentration.
[A bs] T ext box for inputting the standard sam ple absorbance if it is know n. If the
absorbance is unknow n, a value does not need to be input because the
standard sam ple absorbance can be m easured later from the
[Q uantitative M easurem ent] dialog box.