4-31
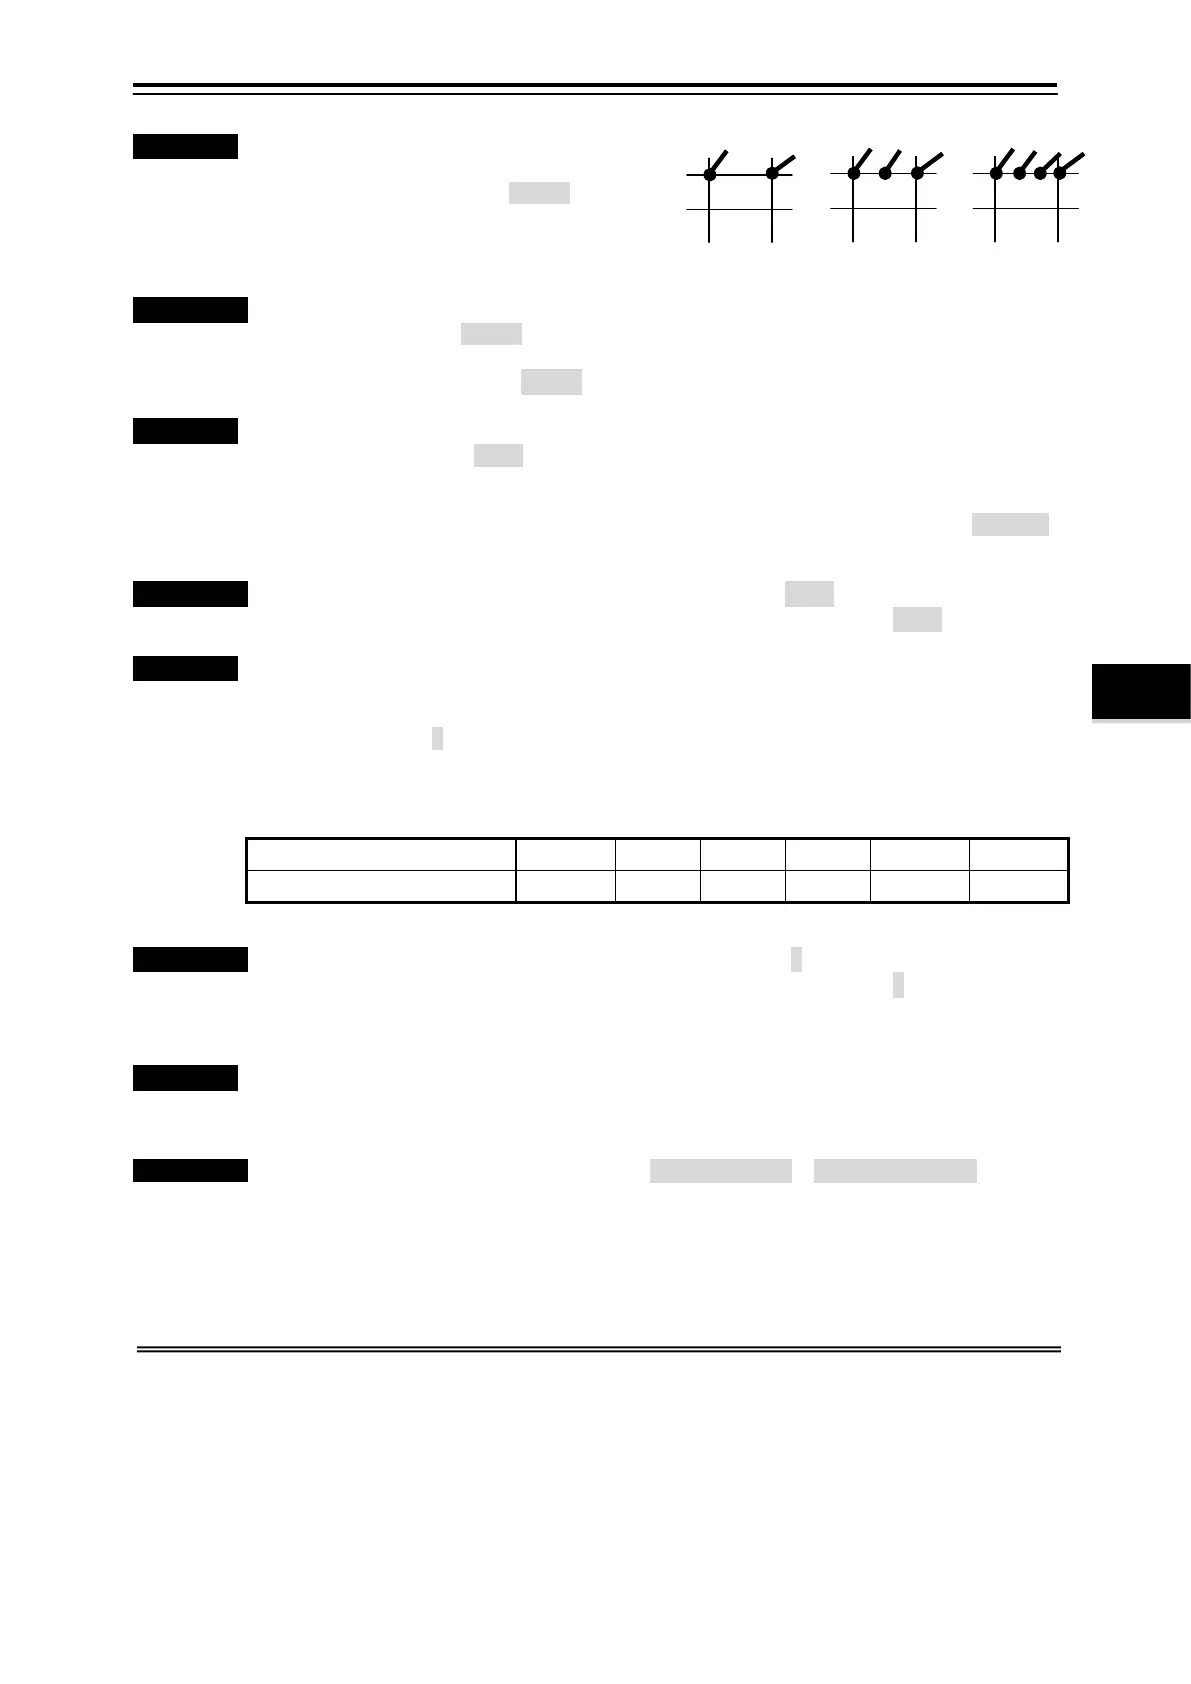
Vector Density
・Function・ The vector display interval in the current
graph is selected.
Setting value: [Normal High S-High]
Normal: The vector is displayed on the
intersection in the grid.
High, S-High: The vector is displayed
between grids.
Operation Standard Menu: “Graph Picture setting”
Menu /Vector Density: S-High
Selection Frame Menu: “Current and Depth
graph” menu/Vector Density: S-High
Back Color
・Function・ The background color in the graph is selected from either of the following, set values.
Setting color: [Standard Black Dark-Blue Gray White]
The graph background color of the GRAPH screen is common to the graph of the current
speed/depth, ship speed, water temperature, the graph of wind direction/speed and set.
The screen background color pairs with the background color in the graph in the standard,
and the background color in the graph is decided by the background color of the screen,
too. The background color of the screen is set by screen brightness (*1) of the main menu.
Operation Standard Menu: “Graph Picture setting” menu/Back color: Black
Selection Frame Menu: “Current and Depth graph” menu/ Back color: Black
Time Scale
・Function・ The time of a graph horizontal axis is set.
The axis of the time of the GRAPH screen is common to all graphs of the current
speed/depth, ship speed, water temperature, the graph of wind direction/speed and set.
Setting value: [ 0.5 1 3 6 12 24 ] h
The storage time synchronizes with "Record Time of the track screen". Set the Record
Time of the track screen according to the table below at length intervals when you want to
lengthen the Time Scale of the [GRAPH] screen.
[PLOT] Screen: Record Time
6 sec
15 sec
30 sec
60 sec
120 sec
240 sec
[GRAPH] Screen: Time Scale
0.5
1
3
6
12
24
Operation Standard Menu: “Graph Picture setting” menu/Time Scale: 1 h
Selection Frame Menu: “Current and Depth graph” menu/Time Scale: 1 h
4.5.2 Ship Speed Graph Setting
・Function・ The elapsed time of ship speed is displayed in the graph. The range of the display depth
can be changed by a set menu.
When ship speed becomes outside the display ship speed range, the short dashed line is
pulled on a horizontal axis of the frame outside the graph.
Operation Standard Menu: [MENU] key/Menu screen/Picture setting≫ / [GRAPH] screen≫/[ENT]
key/“Graph Picture setting” menu
Selection Frame Menu: [□] key/ Enclose “Ship speed graph” with the frame /[MENU]
key/
“Ship speed graph” menu
*1 The screen brightness: As for the background color of the screen, the selection change can be done by menu/screen
brightness/light and dark. The color corresponding to brightness and darkness is selected from four colors (Black, Navy Blue,
Gray, and White) by the submenu setting.
*2 The storage time of [GRAPH] screen setting is given to priority. When the storage time will be set in a long time, the storage
interval of the track screen becomes long.