4-18
4.2 Current Display Setting
4.2.1 Current Circle Graph Setting
・Function・ The current circle graph is set.
Setting items: Current speed range, Current vector display, Ship speed vector, Enlarge of
graph, Wind direction arrow
Operation Standard Menu: [MENU] key/Menu screen/Picture Setting ≫ / Curr≫/[ENT] key/Tidal
Current Picture Setting menu
Selection Frame Menu: [□] key/ Enclose “Current circle graph” with the frame /[MENU]
key/Current Circle Graph menu
Current Speed Range
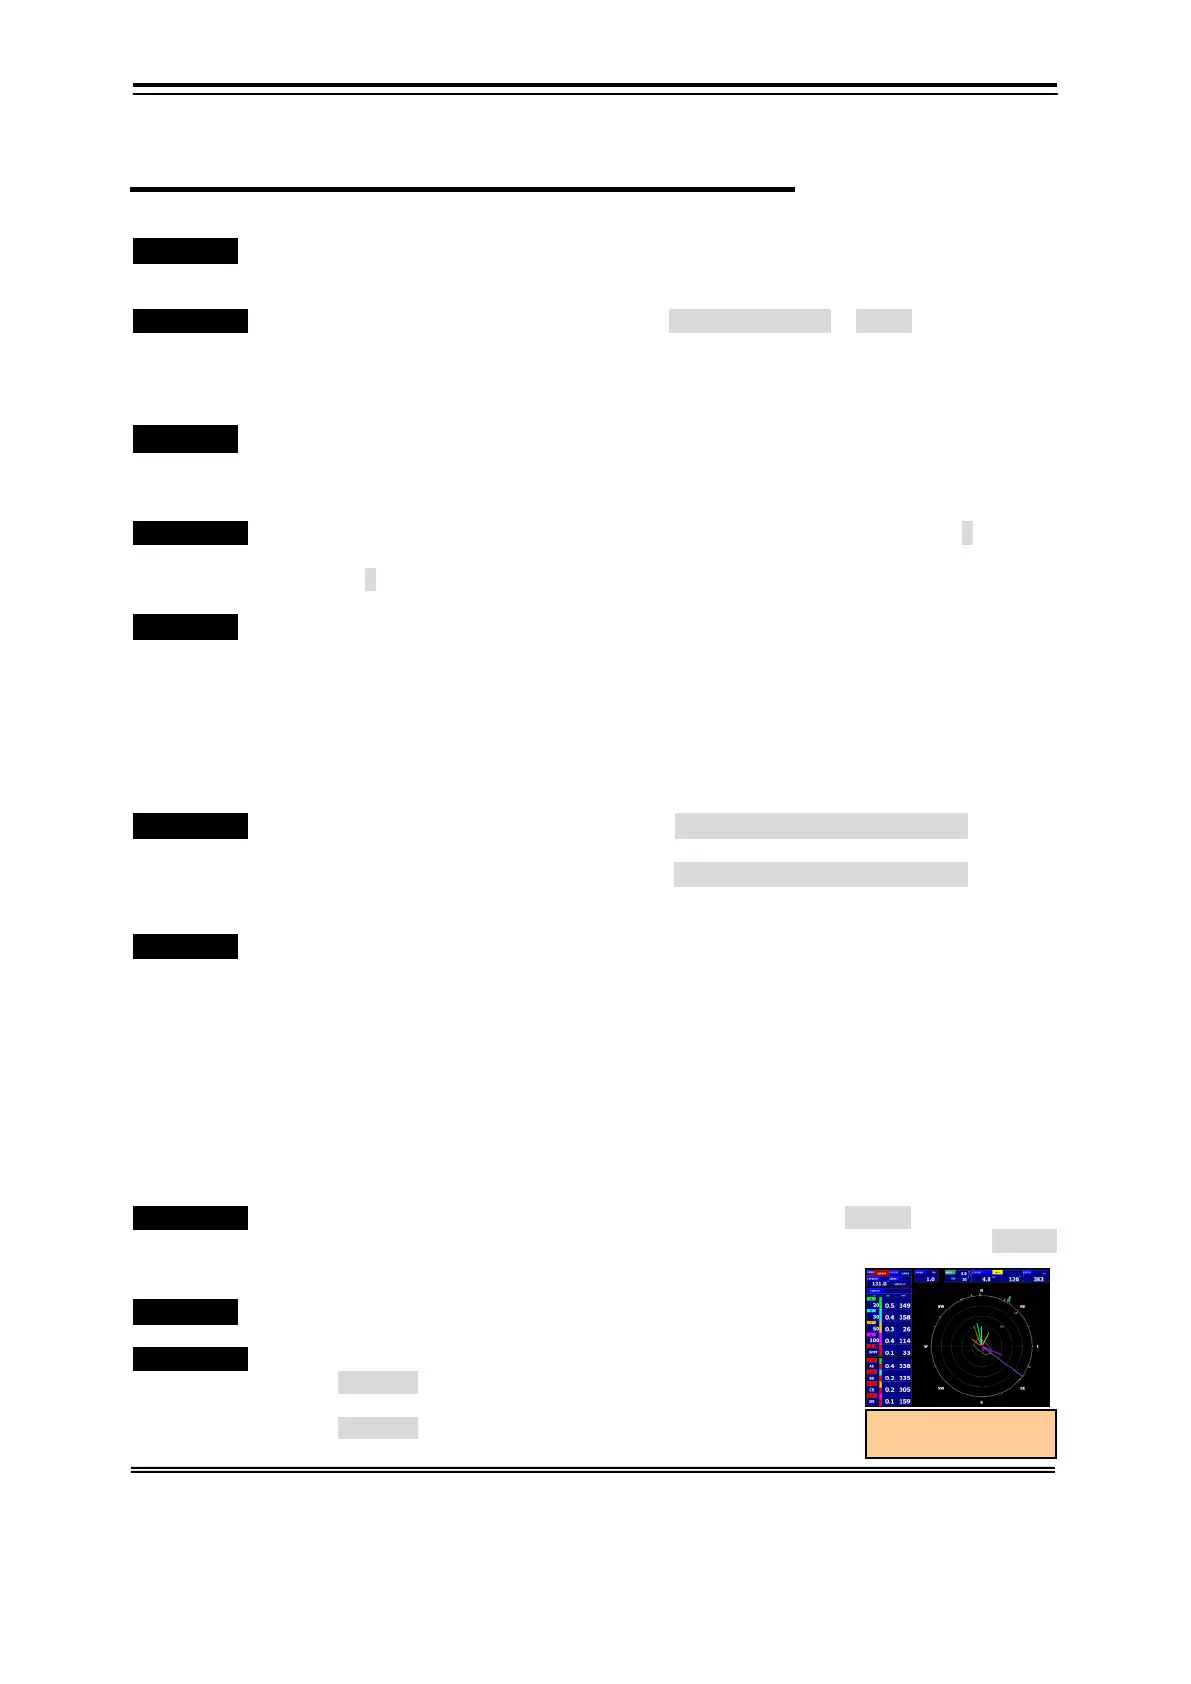
・Function・ The circle range is set. Refer to Ex.① in the Fig.4.2.1
Range: Select from 1-10 kn
Automatic: The reduced scale within the range changes automatically responding at the
measured Current speed when setting it to automatic.
Operation Standard Menu: Tidal Current Picture setting /Current speed range: Automatic/1-10 kn
Selection Frame Menu: Current Circle Graph menu/ Current speed range:
Automatic/1-10 kn
Current Vector Display/Non-display
・Function・ Whether it displays each vector of Absolute current A-E layer and relative current.
Display: The corresponding vector is displayed on the pie chart.
Non-display: The corresponding vector is not displayed.
Ex. ② in figure: Absolute current vector of A layer, B layer, and C layer are displayed.
The absolute current vector is displayed by the solid line.
Ex. ③ in figure: A relative current displays the AC layer and the BC layer based on C
layer and the vector is displayed.
The relative current vector is displayed in the short dashed line. (*1)
Operation Standard Menu: Tidal Current Picture setting /Current Vectors display ON・OFF /Absolute
current: Display ON / Relative current: OFF
Selection Frame Menu: Current circle graph/ Current Vectors display ON・OFF /Absolute
current: ON / Relative current: OFF
Ship Speed Vector Display/Non-display
・Function・ It is set whether to display the ship speed vector on the circle graph.
Display: The ship speed vector is displayed on the circle graph. Ex. ④ in the
figure
It doesn't display it any more on the outer line in the circle graph when
ship speed (vector length) exceeds the range in the graph.
Non-display: The corresponding ship speed vector is not displayed.
Ex. ② in figure: Absolute current vector of A, B, C, D, Elayer are displayed.
The absolute current vector is displayed by the solid line.
Ex. ③ in figure: A relative current displays the AE,BE,CE layer and the DE layer
based on E layer and the vector is displayed.
The relative current vector is displayed in the short dashed line. (*1)
Operation Standard Menu: Current screen setting menu/Ship speed vector: Display/Non-display
Selection Frame Menu: Current circle graph menu/ Ship speed vector: Display
/Non-display
Enlarge of Graph: Standard/Enlarge
・Function・ When the enlarge is selected, the circle graph display is
increased by a factor of about 1.3. (*2)
Operation Standard Menu: Current screen setting menu/Graph
enlarge: Standard/Enlarge
Selection Frame Menu: Current circle graph menu/ Graph
enlarge: Standard/Enlarge
*1 The layer of the standard cannot be displayed on the relative current. For instance, when it is E layer standard, "Relative current
vector EE" is non-display.
*2 Refer to 2.2.1 “Tidal Current Display”.
Circle Graph:
Ex. Enlarge Display