2-12
2.2.3 Track Plot Display
The own tracks are displayed on the screen, and the current direction/speed vector of five layers are
displayed on the track.
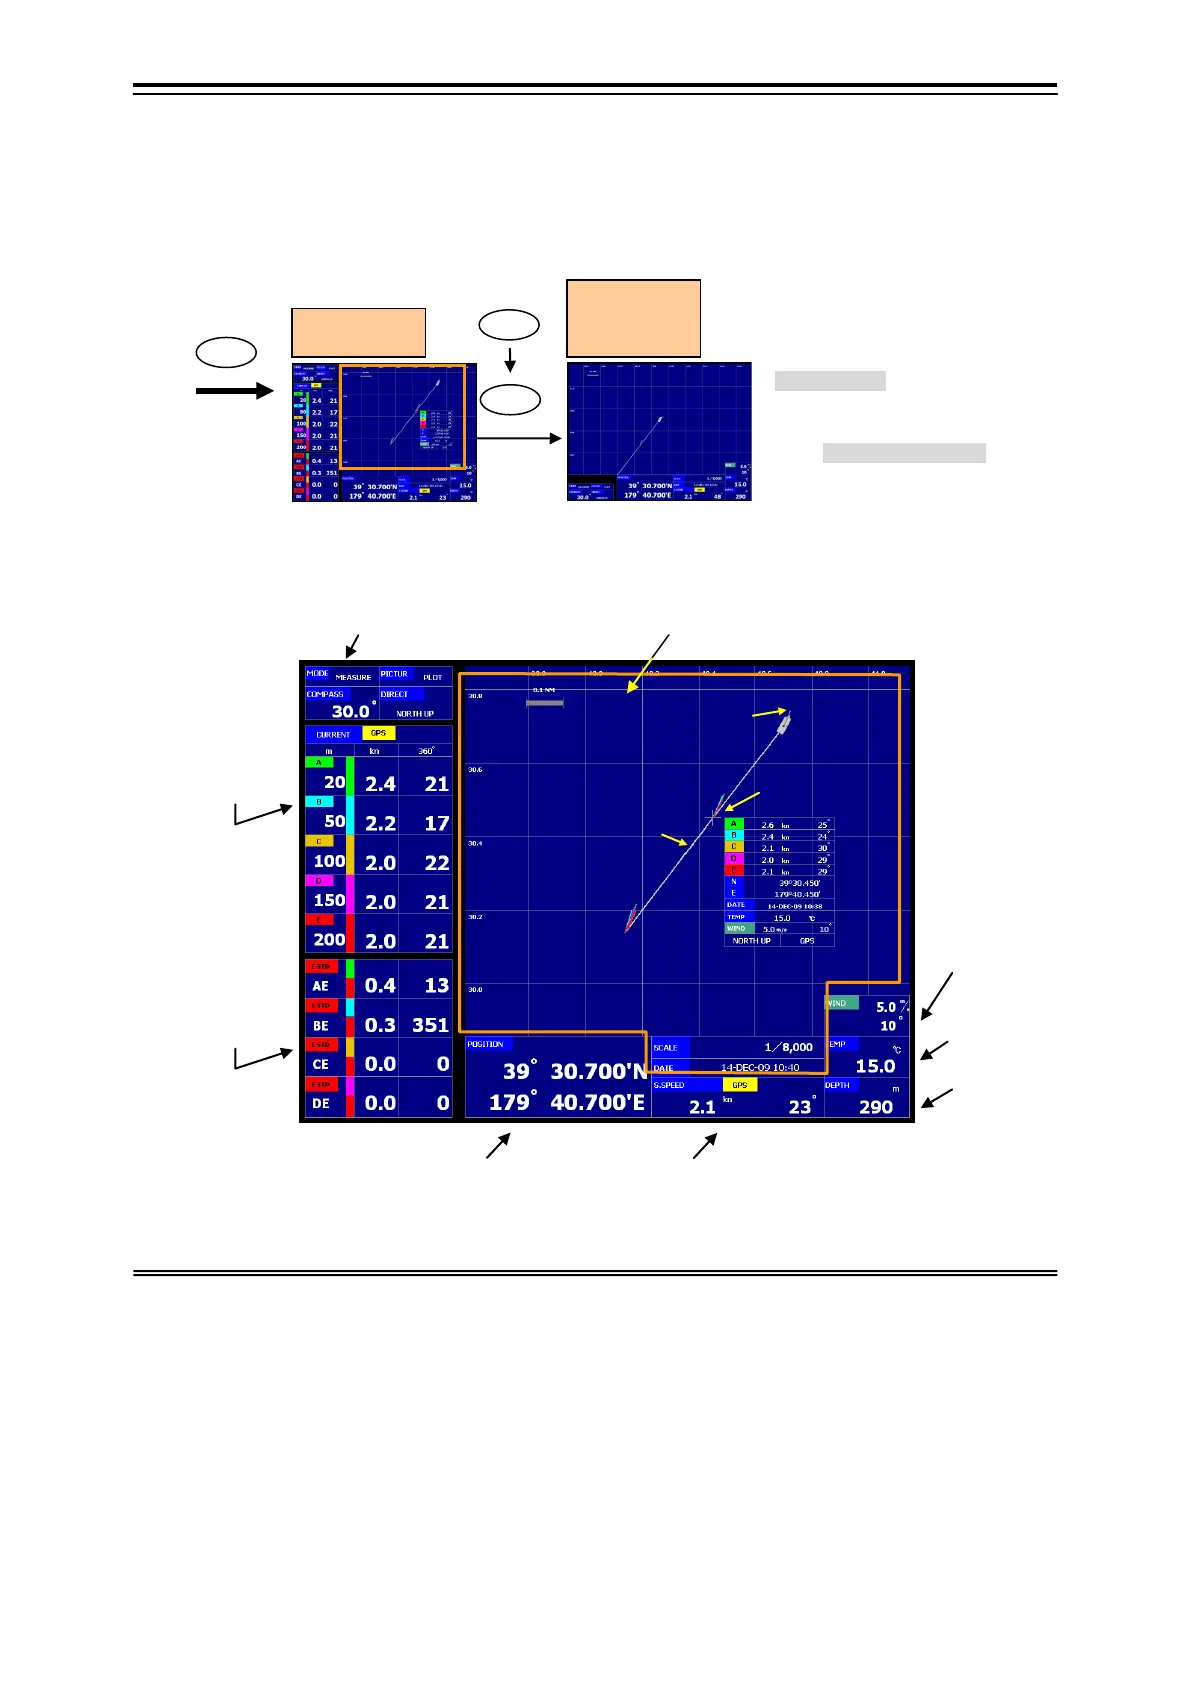
The track screen is displayed with the [PLOT] key. It is possible to display it by extending the range of the
track display in the menu.
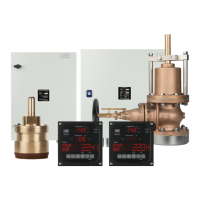
Track plot screen: Example of display
*301 Refer to 4.4.1. Current Numerical Display: Display / Non-display
*311 Own Track Display:
1) Own Ship: Own ship is displayed by ship shape mark.
2) Course Vector: A present direction of the course is displayed from a present ship position by a white solid line.
3) Own Track: The track is plotted on the screen based on information of the GPS location or the ship speed by Doppler data.
The track color can be displayed by one optional color (It is possible to select it from six colors). Or, classification (four
stages) display is possible according to the scattered intensity of an optional measurement layer (A, B, C, D, and E layer).
Refer to 4.4.3
4) Current Vector (5 layers):
The current vector is displayed at constant intervals. The display form of the vector is equal to
the current screen. The absolute current displays a solid line and a relative current in the short dashed line. Moreover, it can
be on/off of the display in each vector. It doesn't display when the measurement is not possible. Refer to 4.4.2 “Five Layer
Display of Current Vector”
Temperature
Year/Month/Date/Time
Absolute Current:
Depth
Current
Speed
Direction
Relative Current:
Standard Layer
Current
Speed
Direction
Ship Speed
Course
Doppler S.Speed: Bottom Tracking/Water Tracking
GPS Ship Speed: GPS
Wind Direction
Wind Speed
Own Track Display:
Track Plot Screen
Mode/Screen
Position Data
Extension
Display
The range of the track display is
enlarged when the current numerical
value display / non-display is selected
by the menu and it displays. *301
・Selecting frame menu display:
12.1.2-(15)