2-18
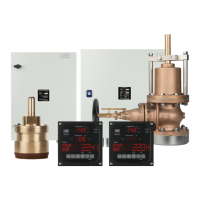
2.2.6 Tidal Profile Display
The current (direction/speed) to depth layer (*601) from the surface to bottom of the sea is displayed in
the graph by the depth of each 2m.
Five current layers of a numeric display are seen, and the current in about 50 layers is seen in depth from
12m in depth to 112m in case of addition, for instance, 150m in depth it and because the graph is
displayed at the same time, can the twist of the current from the surface to bottom of the sea and the
change in swinging can be seen.
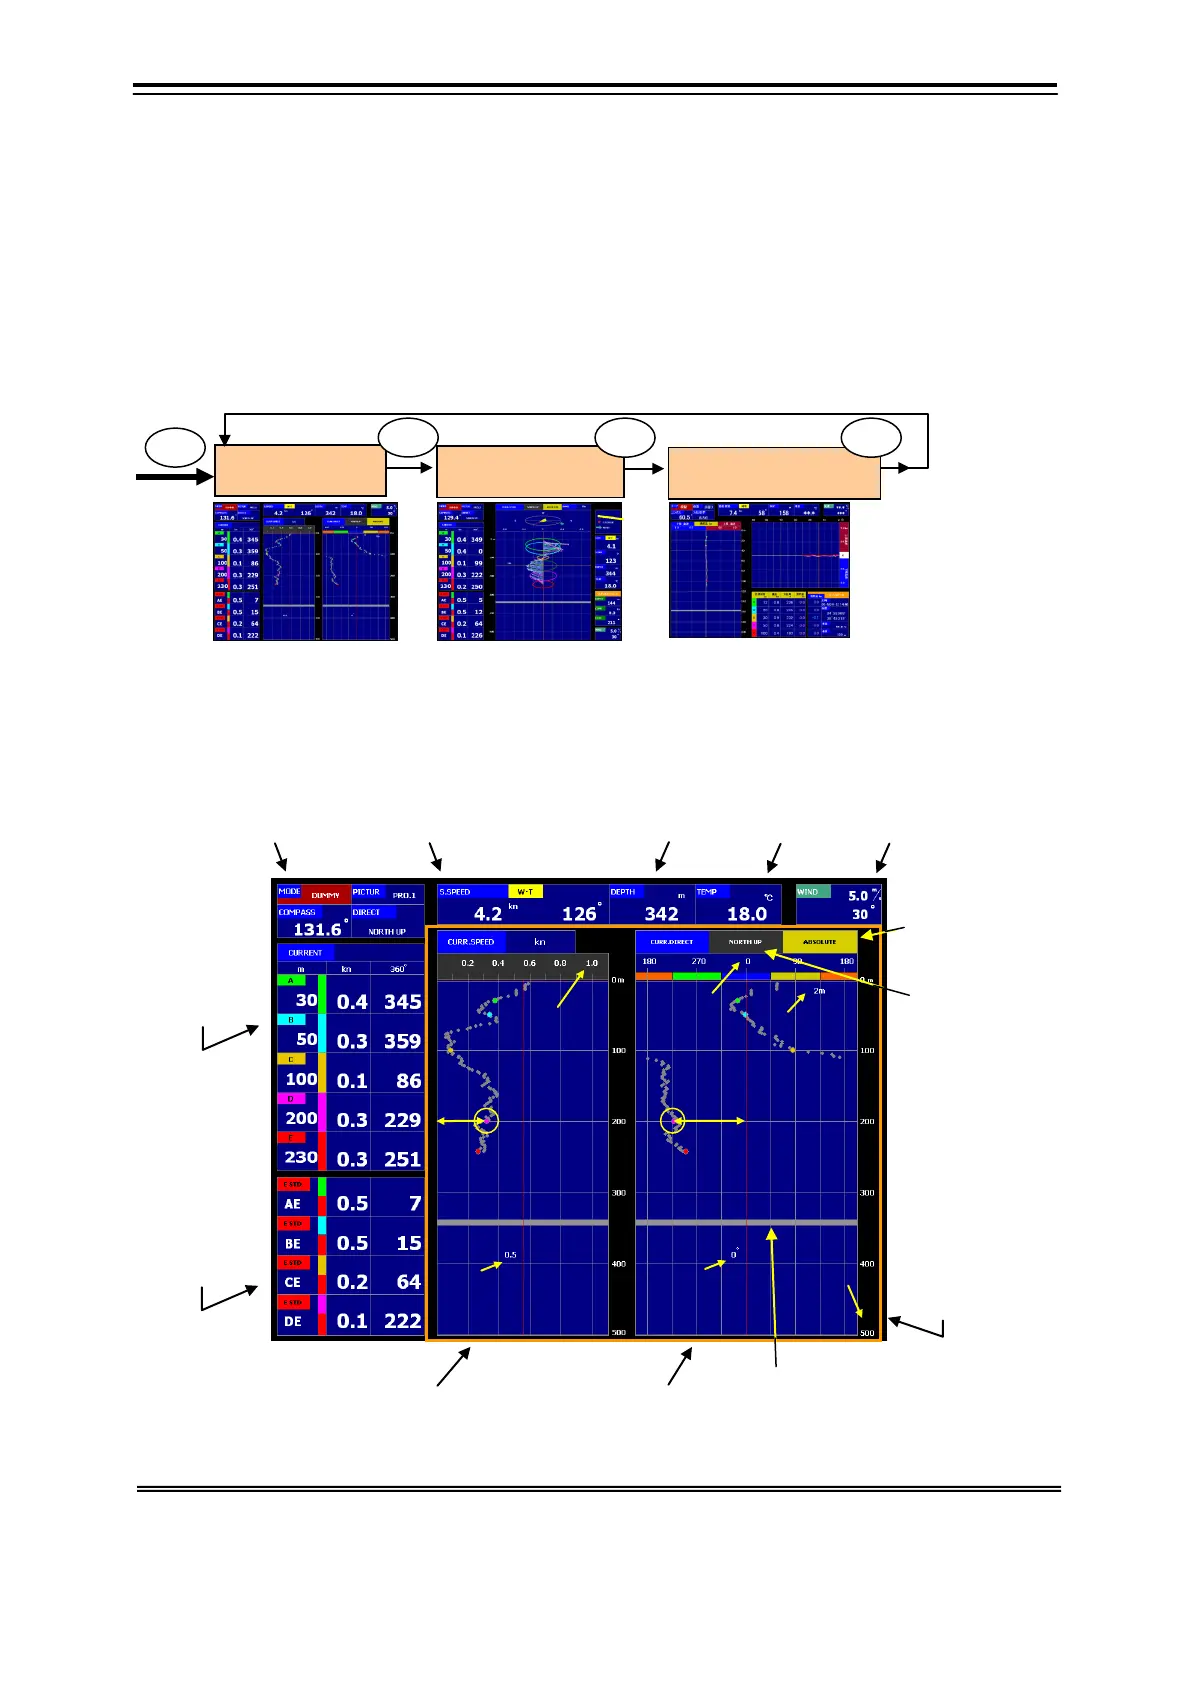
Profile screen is displayed with the [PROFILE] key.
There are two screens; profile 1(line graph) and profile 2(ellipse graph), and the screen changes into the
profile screen whenever the [PROFILE] key is pushed.
1) Profile 1 screen (line graph display): Example of display
*601 Depth in which the current can be measured is up to a depth value of about 80% of the bottom of the sea depth.
Moreover, it changes by the oceanographic condition though the maximum measurement depth of layer is about 200m.
*602 Refer to 4.7.2 “Two Display of Profile Setting (Ellipse Display)”.
Current:
Depth
Current
Speed
Direction
Relative
Current:
Standard
Layer
Current
Speed
Direction
Compass/Bearing
Doppler S. Speed:
Bottom Tracking/
Water Tracking
GPS Ship Speed: GPS
Tem p erature
Wind Speed
Absolute
Relative
Bearing Standard
North up Bearing
Head up Bearing
Depth Range of
Graph
Profile Current
Current Speed
Display Graph
and Depth
Flow Direction Value
D Layer
D Layer
Flow Speed Range
Flow Speed Value
Depth
Profile Current
Current Direction
Display Graph
Profile 1 Screen
Line Graph Display
Profile 2 Screen
Ellipse Graph Display
Profile 3 Screen
Upwelling Graph Display