8-32
Windows Software Reference (Single Chamber Mode)
to send the values to the LI-8100A for implementation; the constants are not
automatically saved to the computer until you choose Save Constants.
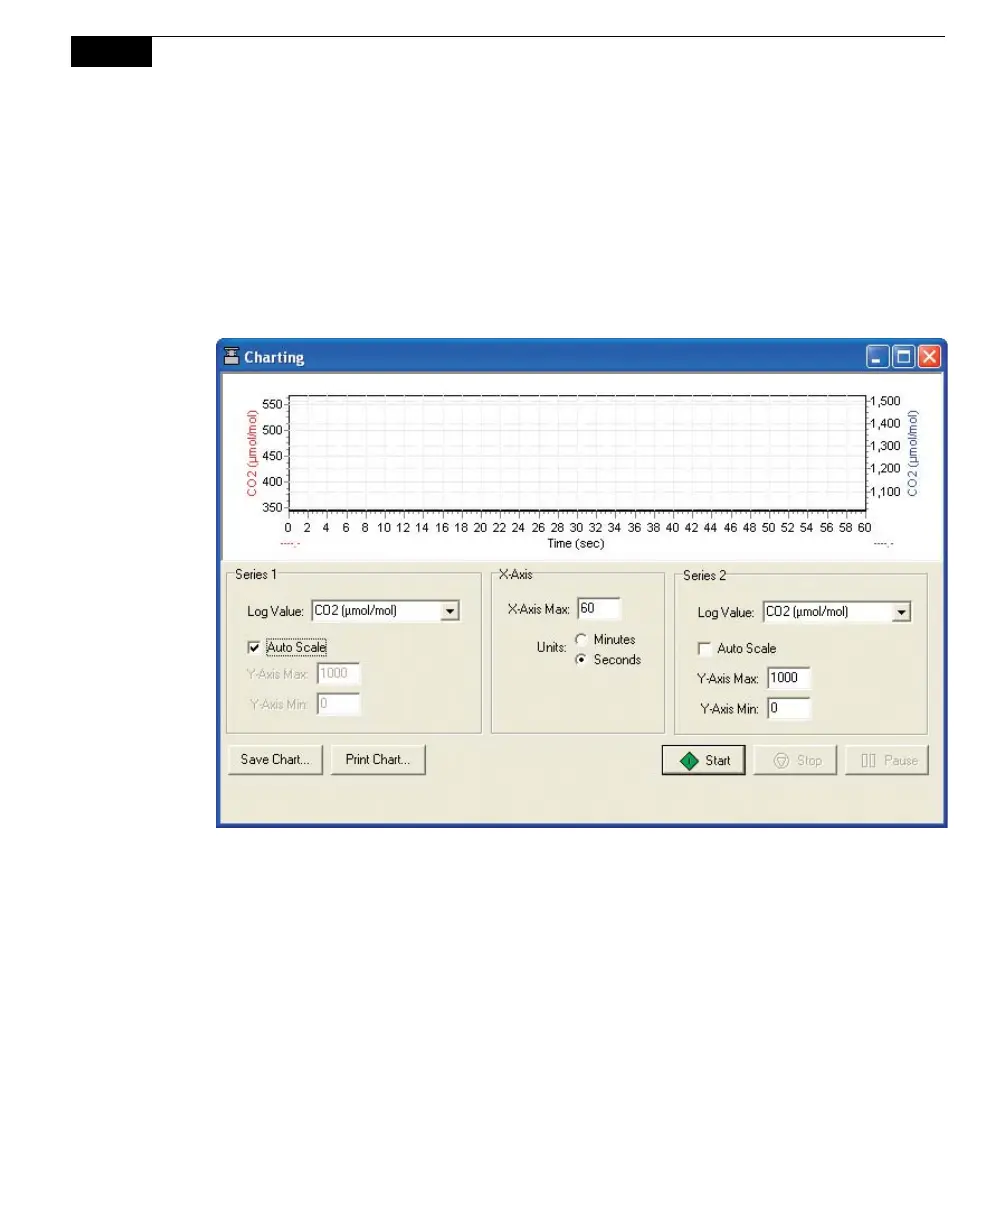
Charting
Select Charting to open the Charting window (below). This is the window in
which you can set up the parameters for plotting your real-time data. Two charts
can be plotted simultaneously, using Y axes on either side of the chart.
Series 1
The Series 1 options are used to plot a chart with the Y axis on the left side of the
chart. Choose the value to be logged, and set the maximum and minimum values
for the Y axis, or enable the ‘Auto Scale’ check box to allow the Y axis to scale
automatically to keep the data from running off of the chart.
Series 2
The Series 2 options are used to plot a chart with the Y axis on the right side of the
chart. Choose the value to be logged, and set the maximum and minimum values
for the Y axis, or enable the ‘Auto Scale’ check box to allow the Y axis to scale
automatically to keep the data from running off of the chart.