4-6
Theory of Operation
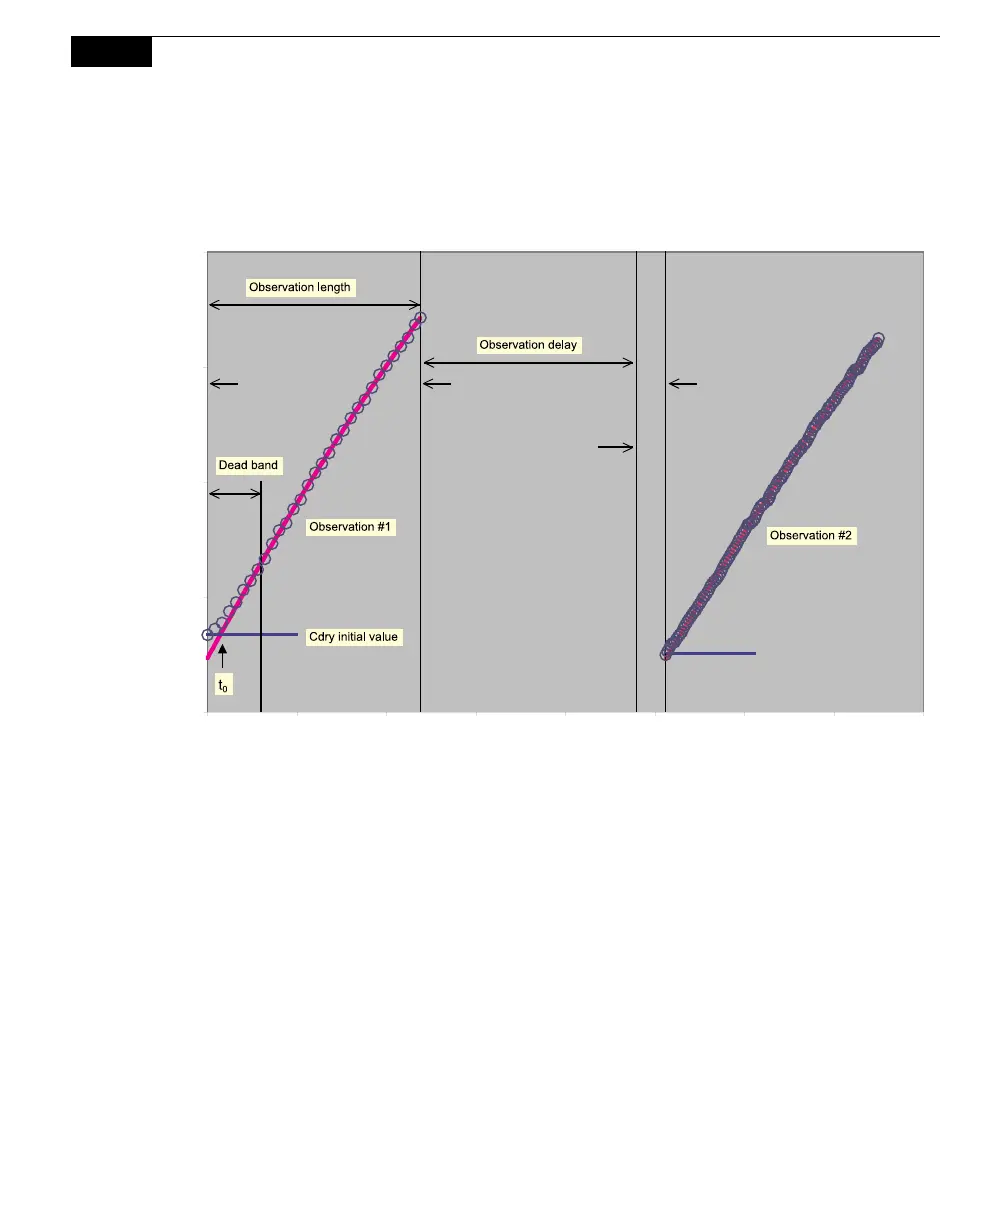
Figure 4-2 shows C'(t) vs t data that were obtained from a soil CO
2
flux
measurement with two observations. The data are marked to show when the
chamber closed and when it opened.
400
450
500
550
600
0 50 100 150 200 250 300 350 400
Time (s)
Cdry (ppm)
Chamber
closed
Chamber
opens
Chamber
begins to
close
Chamber
closed
Figure 4-2. Soil CO
2
flux data were collected on bare soil in a tropical greenhouse near
Lincoln, NE in February 2004. Two Observations are shown. About 60% of the data from
the first Observation have been removed for clarity. For both Observations, the Observation
length was 120s, Dead band was 30s, and Pre-purge was 120s. The chamber begins to
close at the end of the Pre-purge and the first data point used in the analysis is collected after
the chamber touches down; the difference represents the time required for the chamber to
close. Observation #1: t
0
=7.3s, C
0
' = 434 ppm, C
x
'
= 1016 ppm, Flux = 6.4 μmol m
-2
s-
1
;
Observation #2: t
0
= 2.0s, C
0
' = 425 ppm, C
x
'
= 1145 ppm, Flux = 6.0 μmol m
-2
s
-1
.
The Dead Band is the time until steady chamber mixing is established, and
typically lasts 20s to 30s. After mixing is stable, the data are fit with an empirical
equation that has a form similar to equation (4-10):
C (t ) = C
x
+ (C
0
C
x
) e
a(t t
0
)
4-13
where C'(t)is the instantaneous water-corrected chamber CO
2
mole fraction, C
0
' is
the value of C'(t) when the chamber closed, and C
x
' is a parameter that defines the