5.3 Option software chart
FRA5087
5.3 Option software chart
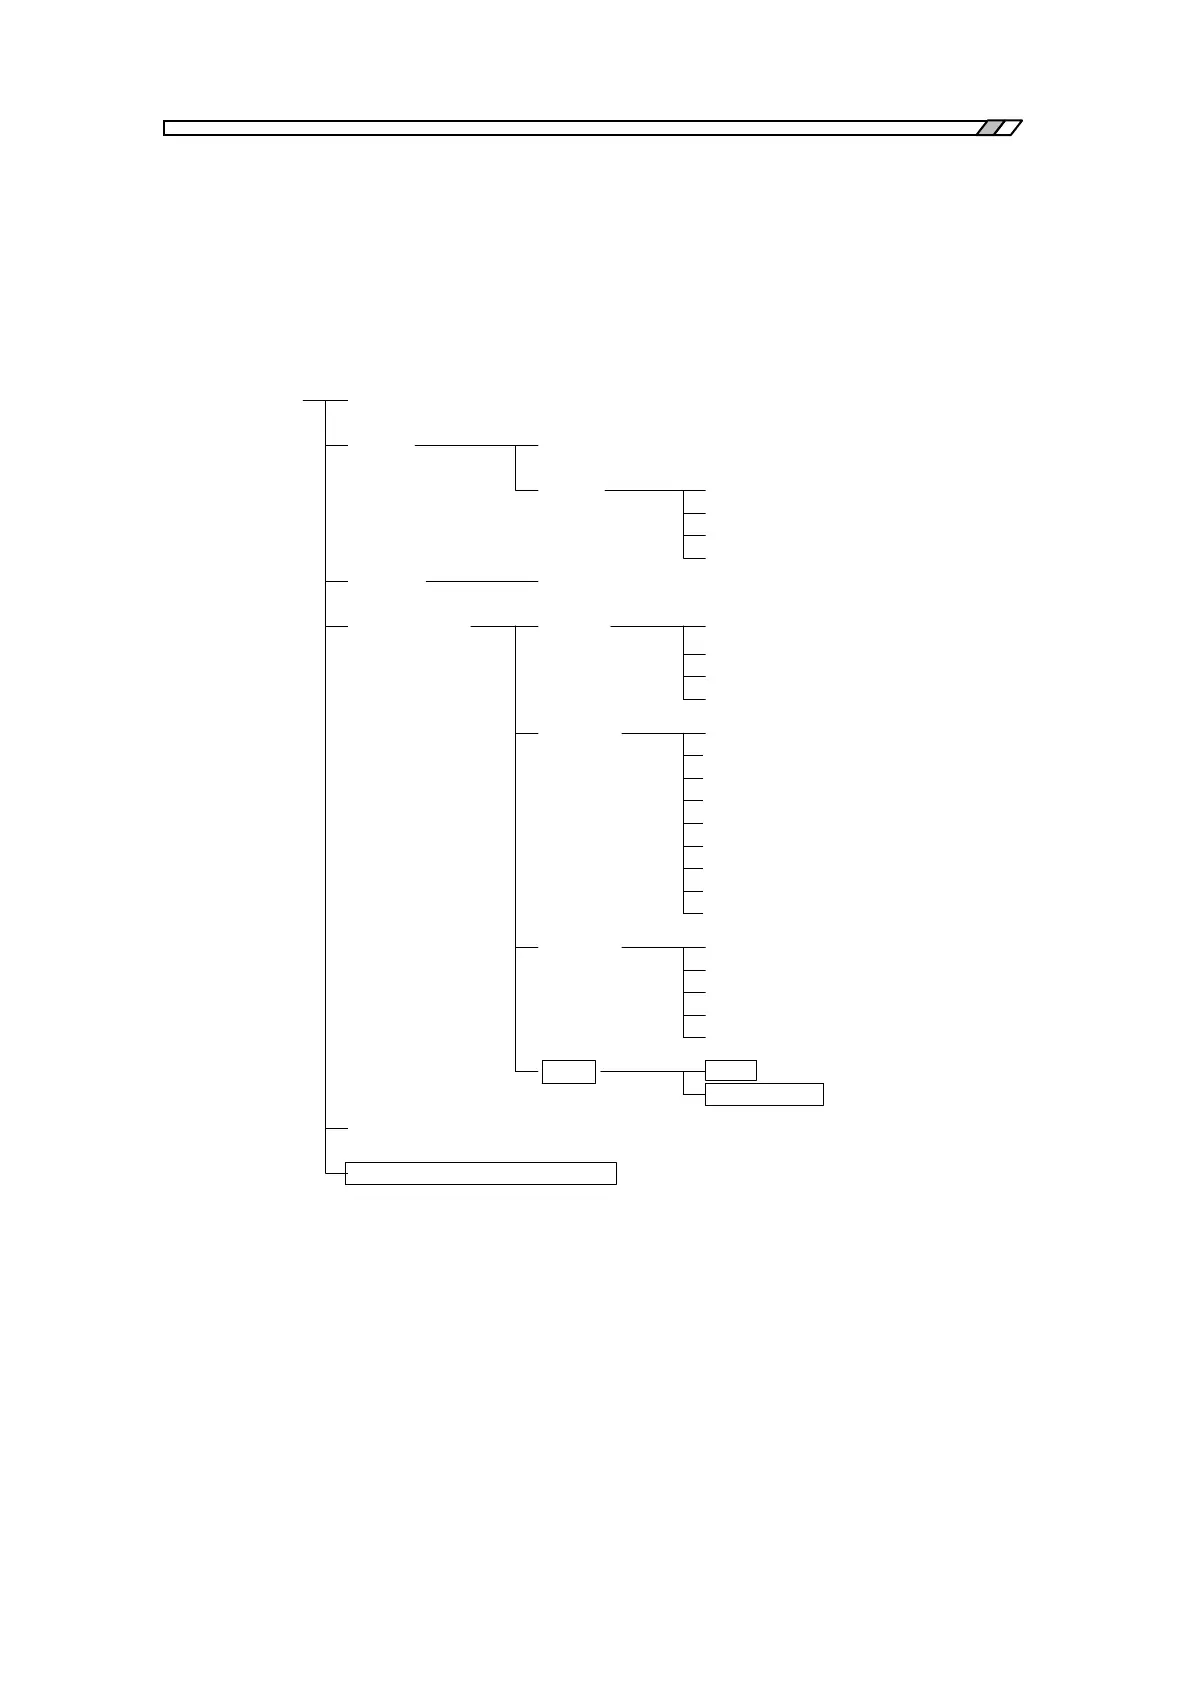
Software additions and changes are indicated as a function tree. Only the additions and changes
to the chart of 1.3 are indicated. Rectangles denote the added and changed locations.
■ Display control (graph) display mode was changed.
Display mode
Graph
・・・
Marker
Grid
Display mode
Max/min detect display (search)
TYPE
STYLE
logF
F
θ
A
dBR
logR
θ
R
logB
logB(-B)
B
X
X-Y1
X-Y2
X-Y1-Y2
X axis
Y1 axis
Y2 axis
・・・
θ
logA
logA(-A)
A
B
-B
GAIN
IMPEDANCE
Units
Display scale
- - -
・・・