4.1 Overview of measurement and processing
FRA5087
4.1.3 Display mode
In the display mode setting, representation methods of graphic display for analyzed data on the
LCD screen, i.e., gain (or amplitude) vs. phase, are specified/set.
The display mode is set through the menu [Graph][FORMAT][DISPLAY MODE]. The data
displayed in the graph depend on the analysis mode setting.
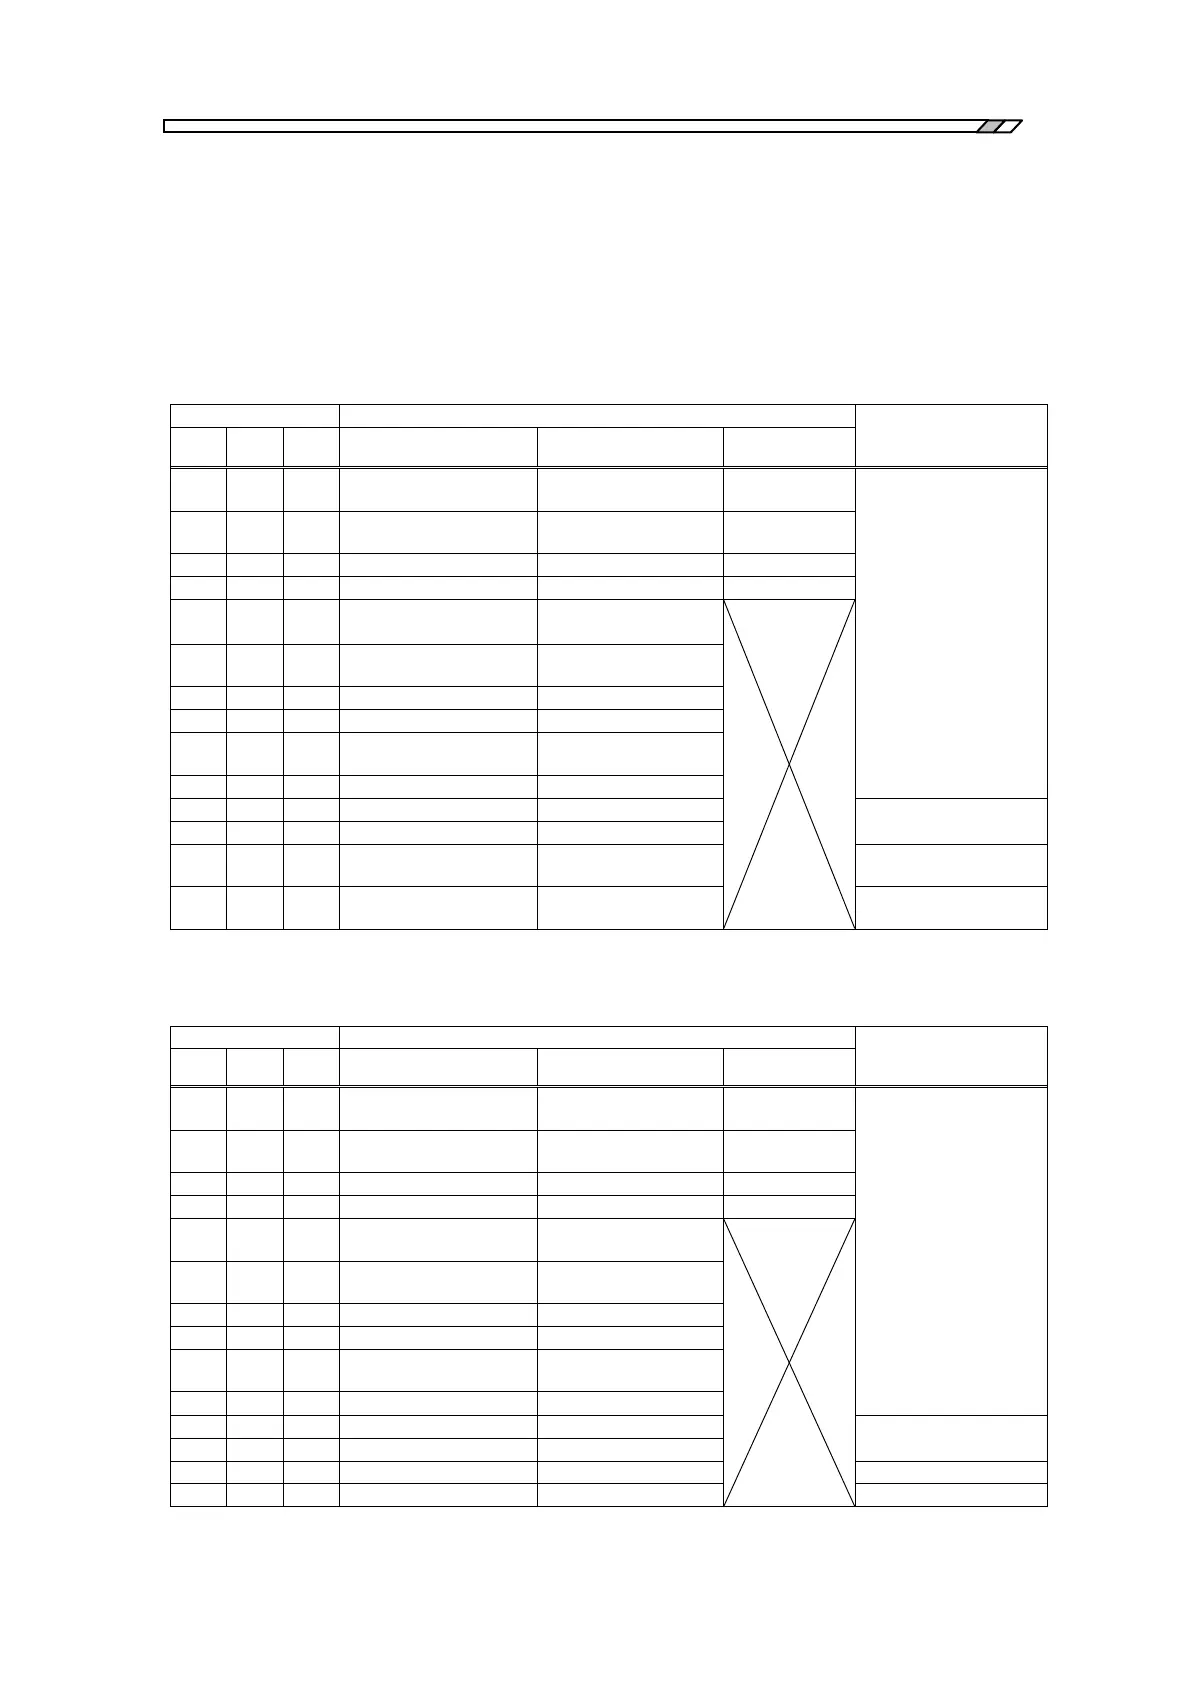
Table 4-2 List of display modes (1) for analysis mode: (CH1) or (CH2)
Frequency (Hz)
Logarithmic scale
Frequency (Hz)
Logarithmic scale
Frequency (Hz)
Logarithmic scale
Frequency (Hz)
Logarithmic scale
Frequency (Hz)
Logarithmic scale
Amplitude real part
(Vrms)
Amplitude imaginary
part (Vrms)
Amplitude real part
(Vrms)
Amplitude imaginary
part (Vrms)
*1: “dBV” is defined with reference to “Vrms”, which means 0 dBV = 1 Vrms.
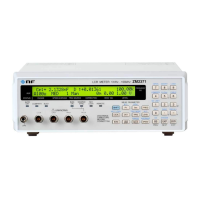
Table 4-2 List of display modes (2) for analysis mode: (CH1/CH2) or (CH2/CH1)
Frequency (Hz)
Logarithmic scale
Frequency (Hz)
Logarithmic scale
Frequency (Hz)
Logarithmic scale
Frequency (Hz)
Logarithmic scale
Frequency (Hz)
Logarithmic scale