3.5 Examples of basic operations
FRA5087
3.5.4 Examples of connections
Typical examples of measurement connections are described in this section. In actual
measurement, be careful about the influence on the SUT of the common- and differential-mode
impedance of the oscillator output and analyzer input in the FRA5087.
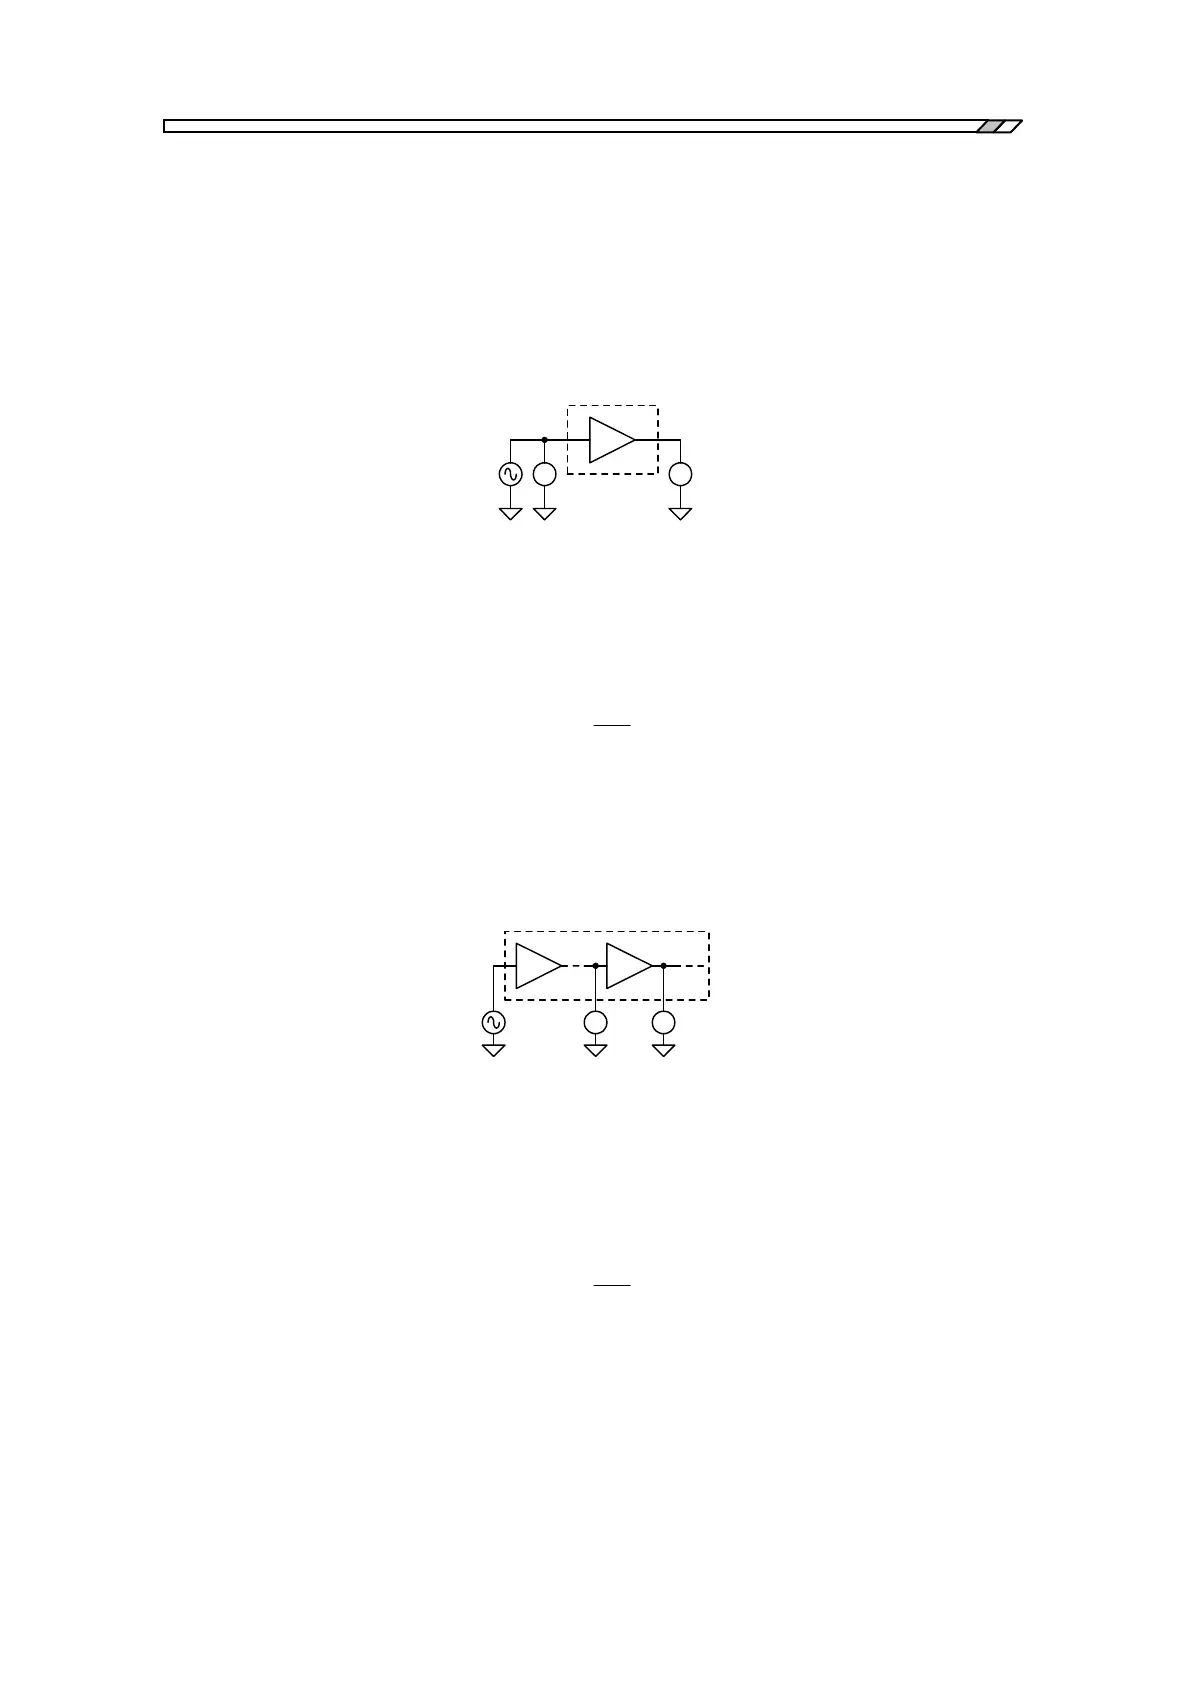
Frequency characteristics measurement of amplifiers (1)
Fig. 3-14 Connection diagram for frequency characteristics measurement (1)
Connect V
1
with CH1 and V
2
with CH2, respectively.
The frequency transfer function of the SUT (system under test) can be obtained from the
following equation:
Set the measurement mode at (CH1 and CH2) and the analysis mode at (CH2/CH1) for the
FRA5087, to display the SUT frequency characteristics (gain and phase versus frequency) on the
LCD screen so that you can directly read them through the display.
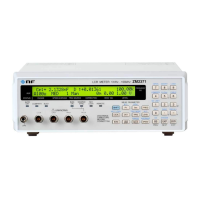
Frequency characteristics measurement of amplifiers (2)
Fig. 3-15 Connection diagram for frequency characteristics measurement (2)
The diagram above shows the connection for measurement of the transfer function of A (only for
A) in the SUT.
The transfer function of A can be obtained from the following equation:
Set the analysis mode at (CH2/CH1) for the FRA5087 to display the frequency characteristics
(gain and phase versus frequency) of A on the LCD screen so that you can directly read them
through the display.