4.8 Route status
The measurement data is analyzed in the OMNITREND Center software. The following ana-
lysis can be performed for a route in VIBSCANNER 2:
4.8.1 Measurement status
After a measurement, VIBSCANNER 2 shows the status of the results as follows:
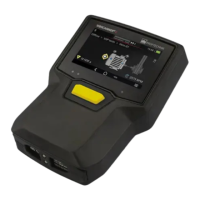
On the measurement location:
The measurement location icon changes the color (red, yellow,
green), when a measurement task exceeded a threshold.
Measurement locations with a blue icon are normal.
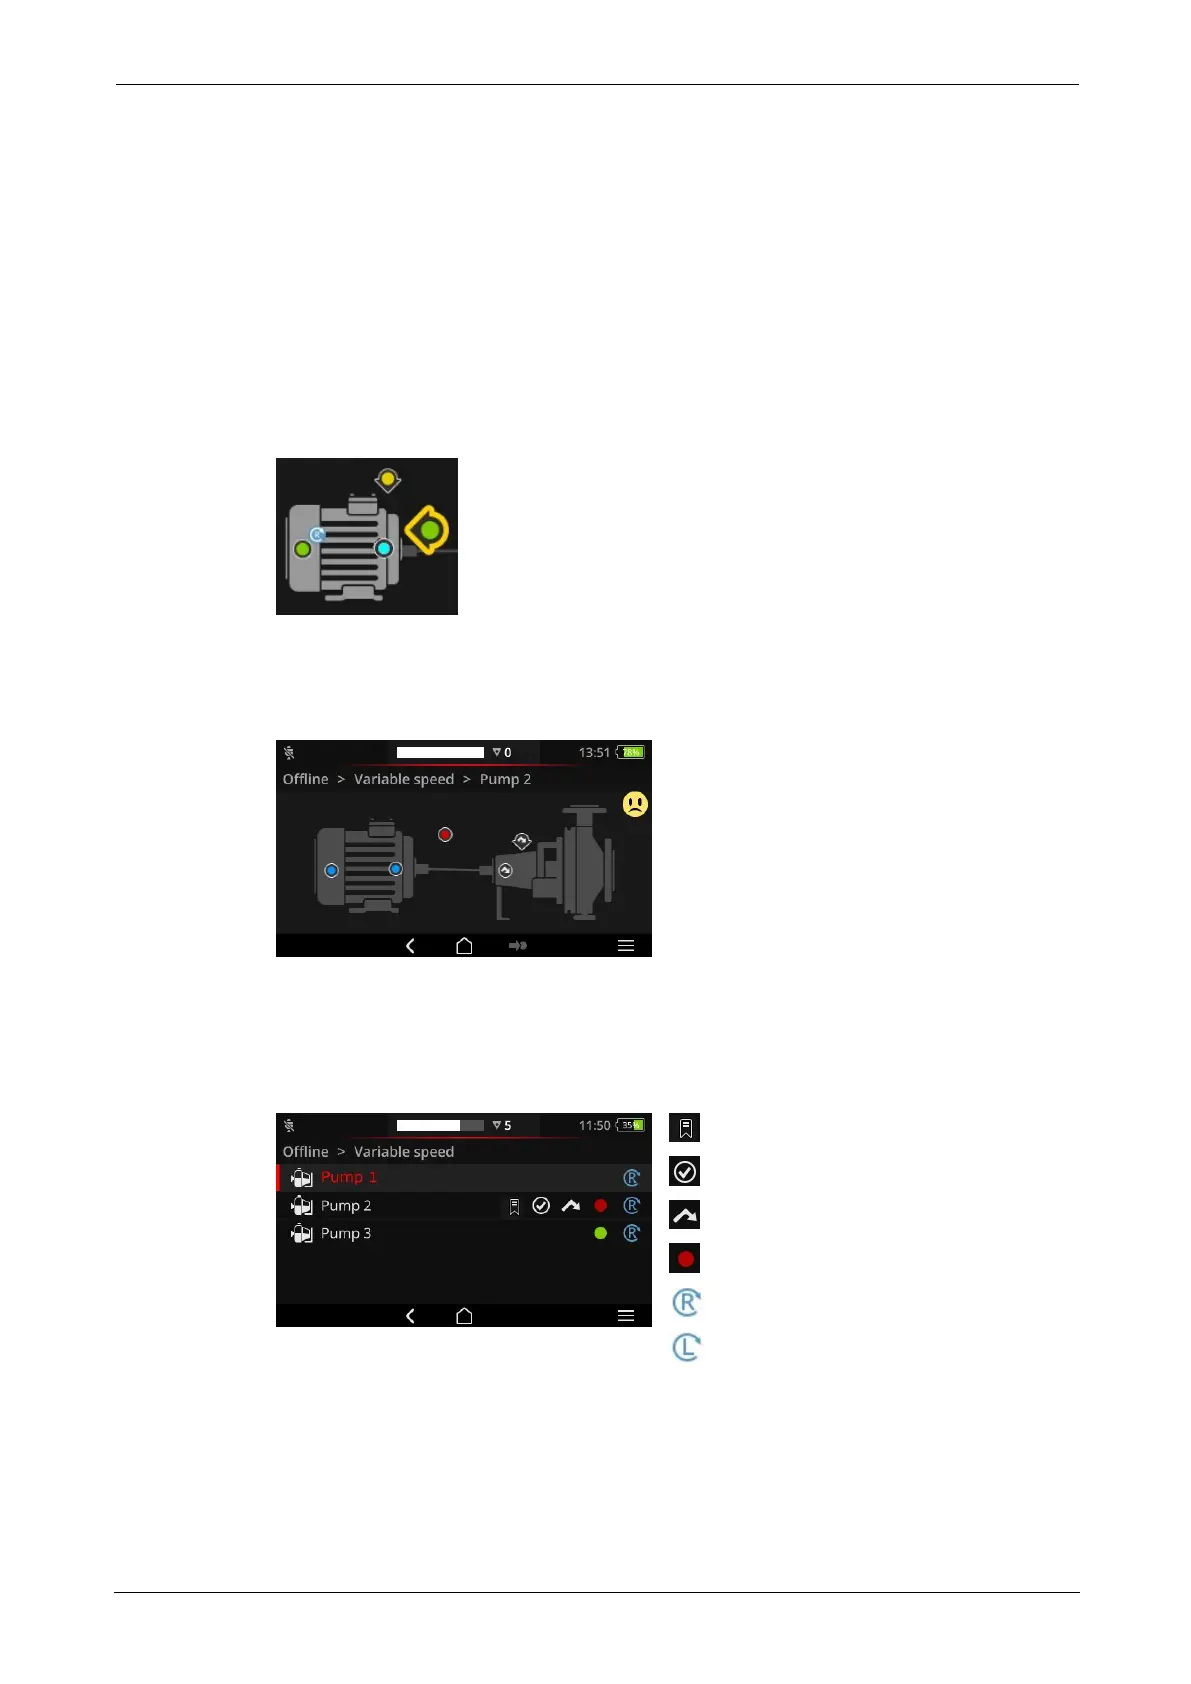
On the machine train
A smiley indicates the measurement status on the machine train.
The most critical status is considered as cri-
terion for the smiley (in the example:
alarm).
This function can be activated in the device
settings: [Settings > Route settings >
Machine train evaluation].
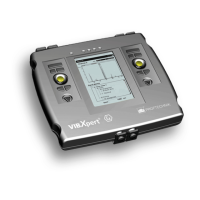
On the site or at higher levels
Hierarchies via a machine train are presented in a list. The measurement status is shown
using icons:
: Bookmark (event)
: finished
: skipped
: exceeds threshold (red, yellow, green)
: contains baseline measurement
:contains line speed
Entries in red font are due for meas-
urement.
VIBSCANNER 2 77
4 - Route