PULSAR MEASUREMENT
33
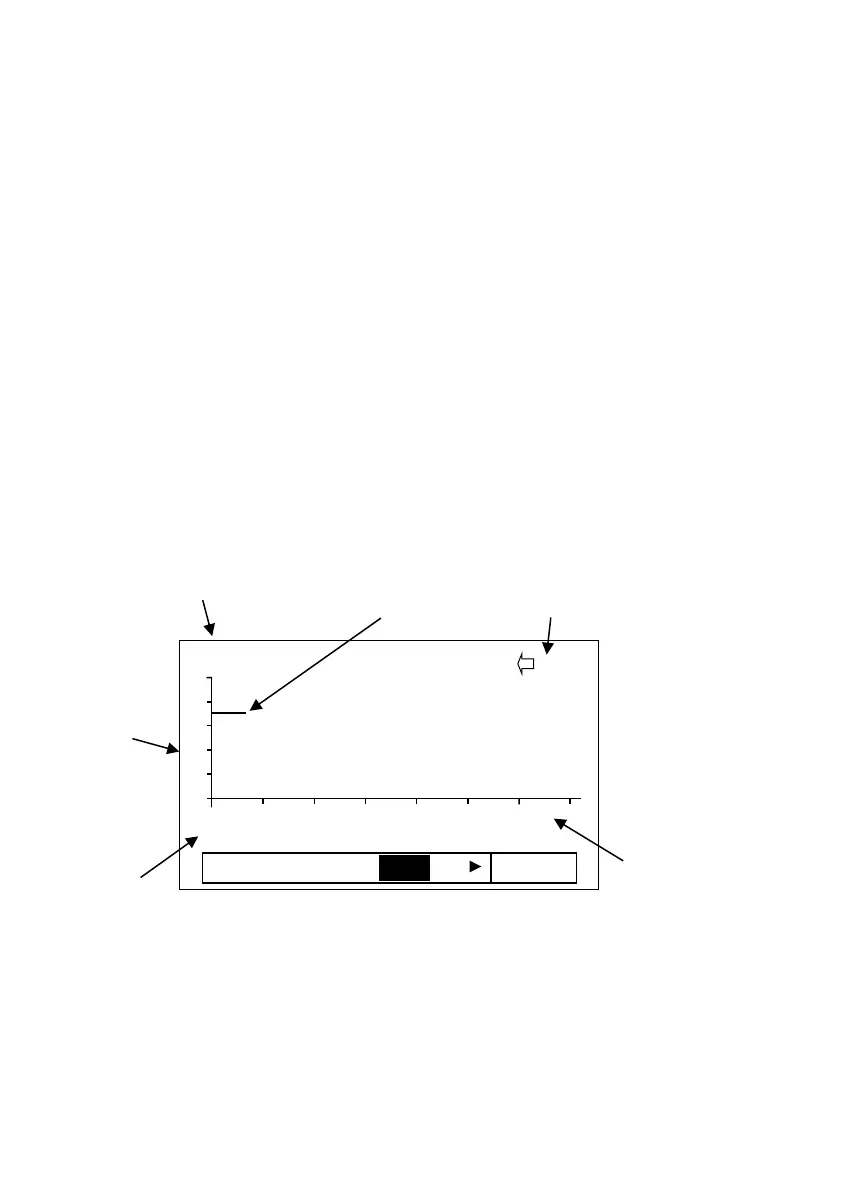
Trend Display
The Trend screen shows live and historical data for selectable measurements.
You can toggle a display of up to 15 selectable measurements used in an
application setup, which are then automatically updated every sample taken.
The frequency of the trend sample taken varies in the user definable
parameter P129 - Sample interval. Pressing the Up and Down buttons
selects the different trending measurements (up to 15).
The LCD shows up to 210 points, and once the screen is full it scrolls left as
each new sample is added. F1 and F2 symbols will appear on the screen
indicating that you can scroll back to view the historical data and return to
current measurements.
The files that the data is saved to is in the form of LyymmddA.CSV. L – log
file and yymmdd = year, month, and a = letter starting at ‘A’ in case more
than one file is created. A new log file will be generated each day for that
month.
 Loading...