3. Description of the QABrowser
Real-time Display and Waveforms
2012-10/4.3A
61
Barracuda & QABrowser Reference Manual
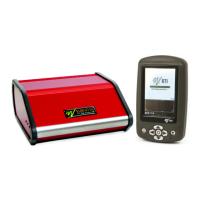
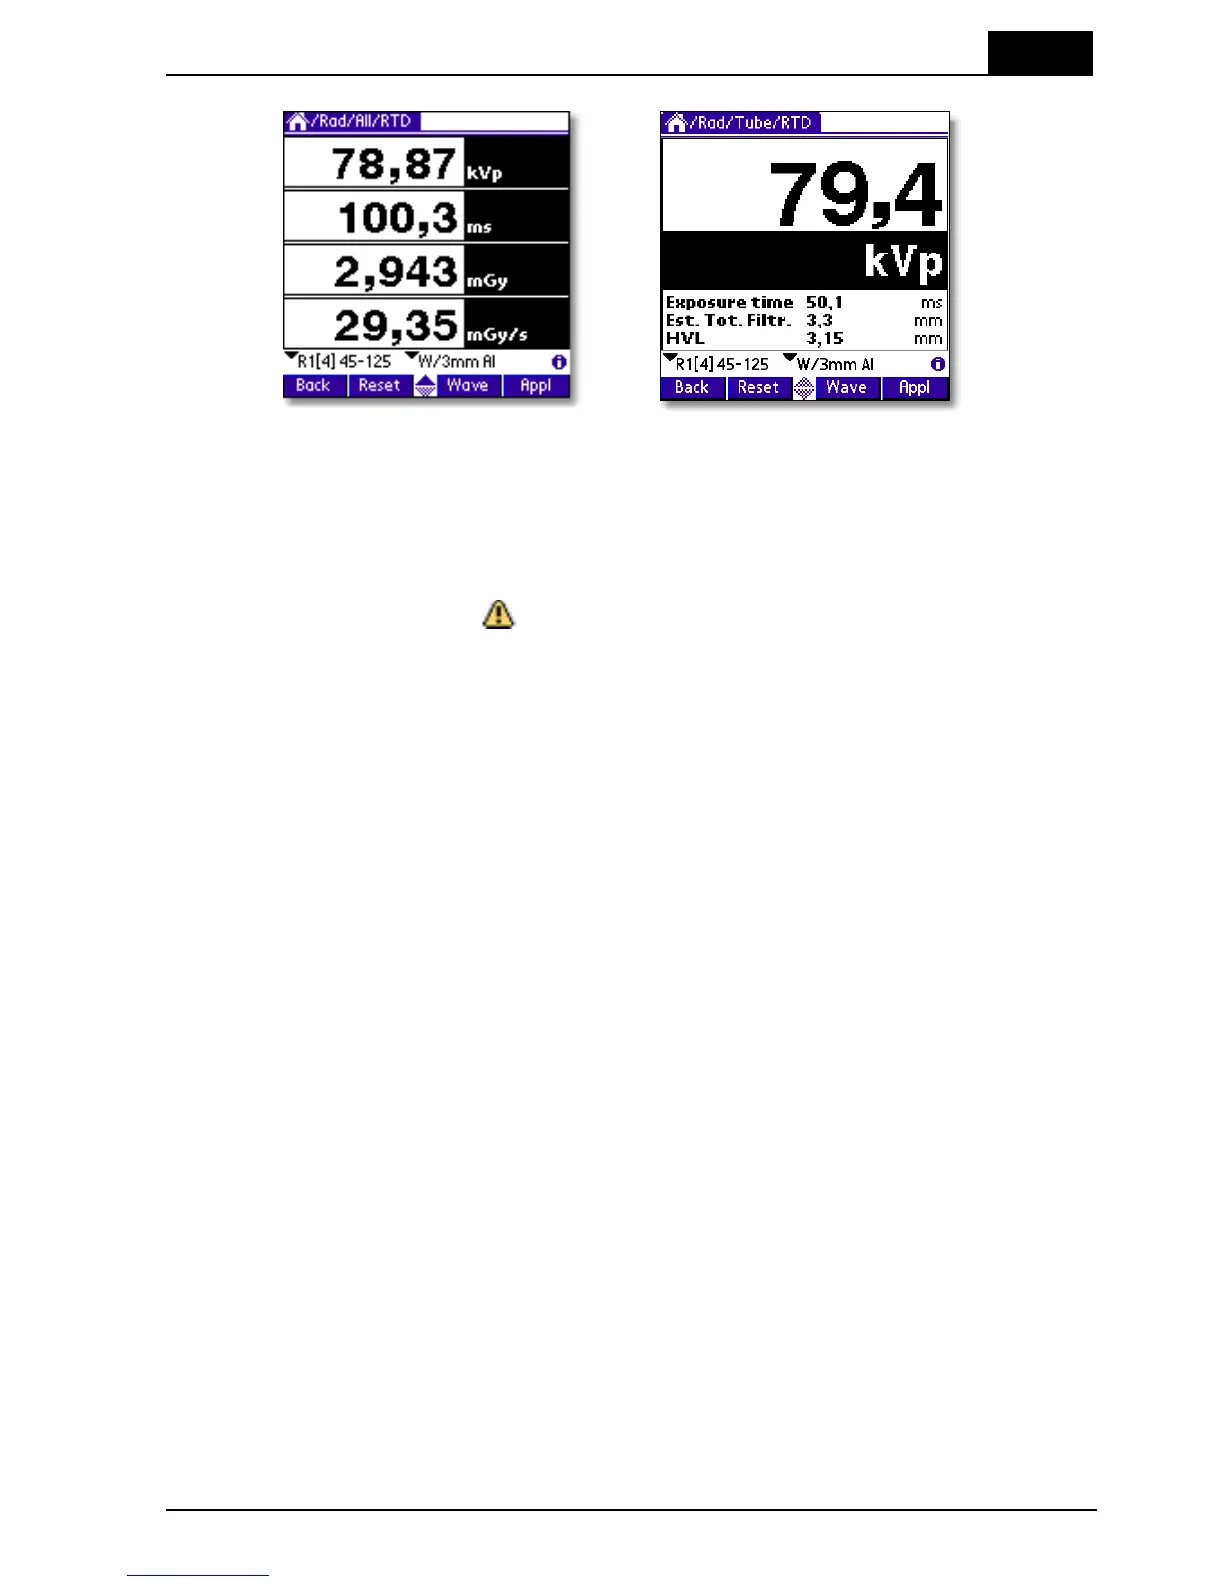
The single parameter displays are large to allow reading from distance. In the single
parameter displays complementary values may be shown (in the figure above
exposure time and total filtration). Which complementary values that are shown
depends on the selected parameter. Up to three complementary values can be shown.
If any of the displayed values is not possible to compensate or cannot be measured
with full accuracy the symbol is displayed at the top of screen. If the symbol is
displayed you can tap it with the pen to display more information.
3.3.2 Waveforms - Acquiring and Viewing
Waveforms are always captured for each exposure you make. Up to three waveforms
are simultaneously captured and visualized with the QABrowser. The following
waveforms can be measured depending on configuration and selected type of
measurement:
· tube voltage (kVp) with the MPD
· dose rate with the MPD
· dose rate with a detector (R100 or an ion chamber) connected to an electrometer
module (EMM).
· tube current (mA) with a mAs-probe connected to an electrometer module (EMM).
For the Electrometer Charge and Current measurement types, it is also possible to get
the actual current input waveform.
In Continuous update mode you also have the possibility to restart the waveform
collection during the measurement. Every time you tap Hold, the waveforms are
acquired again. When you do this, the previously acquired waveforms will be replaced.
The waveforms available for viewing will be the ones from you last Hold tap.
To view waveforms after the exposure: