62 Mega-800 SCINCO
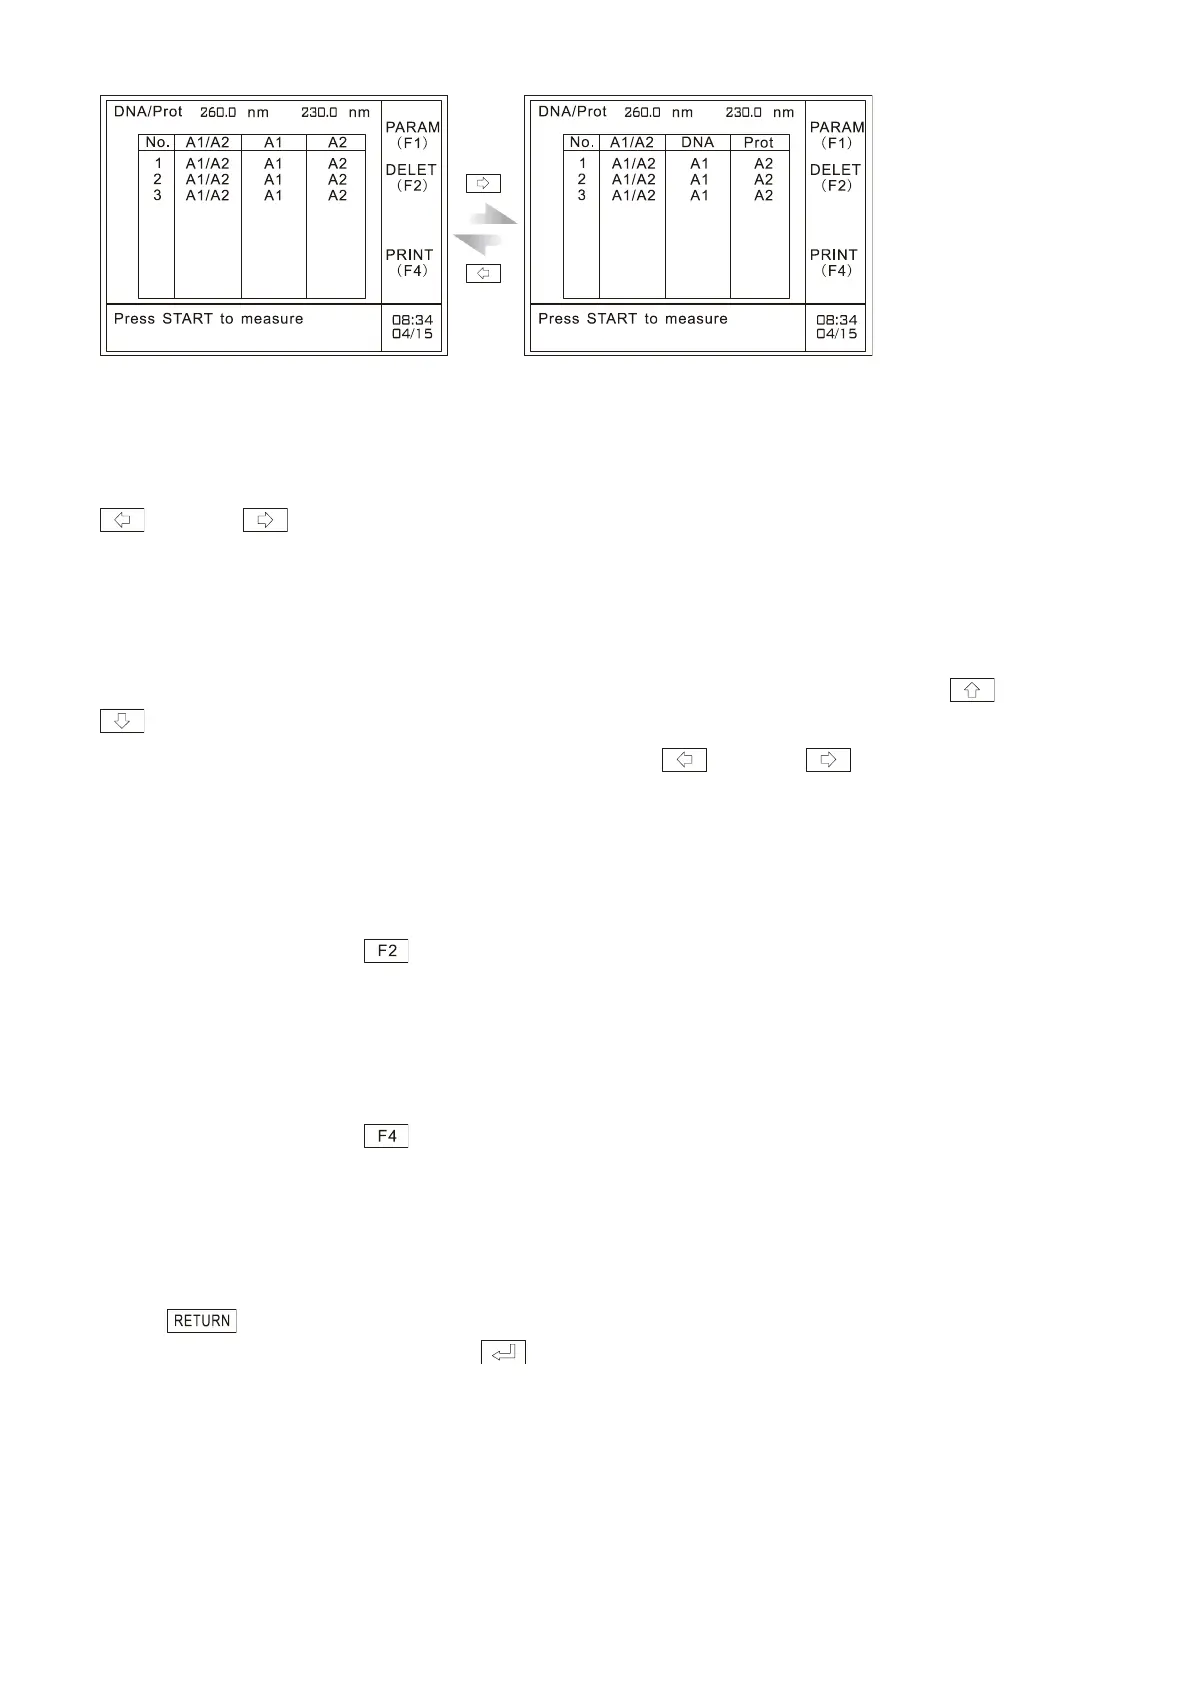
Fig. 6.12 Results display
“No.”in the table refers to the serial number of the samples set by the user. “2”in the table refers to
the result of second measurement; ―A1/A2‖ refers to the aborption ratio of the two calibration
wavelengths; “A1” and “A2”refer to the absorption values of two calibration wavelengths. Press
key and key to display A1, A2, DNA concentration and protein concentration alternately.
For detailed information refer to ―6.7 Look up the measurement results‖.
6.7 Look up the measurement results
After measurement, you can look up the measurement results by pressing cursor keys and
.
The default display is A1 and A2, and the user can press key and key to display
alternately A1, A2 and DNA concentration and protein concentration, as shown in Fig. 6.12:
6.8 Delete the measurement data
After measurement, press key to delete measurement results. Please refer to ―3.7 Delete the
measurement data‖.
6.9 Printout
After measurement, press key to print out the measurement results, including A1, A2, DNA
concentration and protein concentration. Please refer to ―3.8 Printout‖.
6.10 Quit measurement
Press key to quit measurement. It will prompt the user with the information ―Delete all the
data? (YES: Enter; NO: Clear)‖. Press to return to the instrument main menu.