GCMS-QP2010 Series Operation Guide 61
5.3 Analyzing Data
5
3
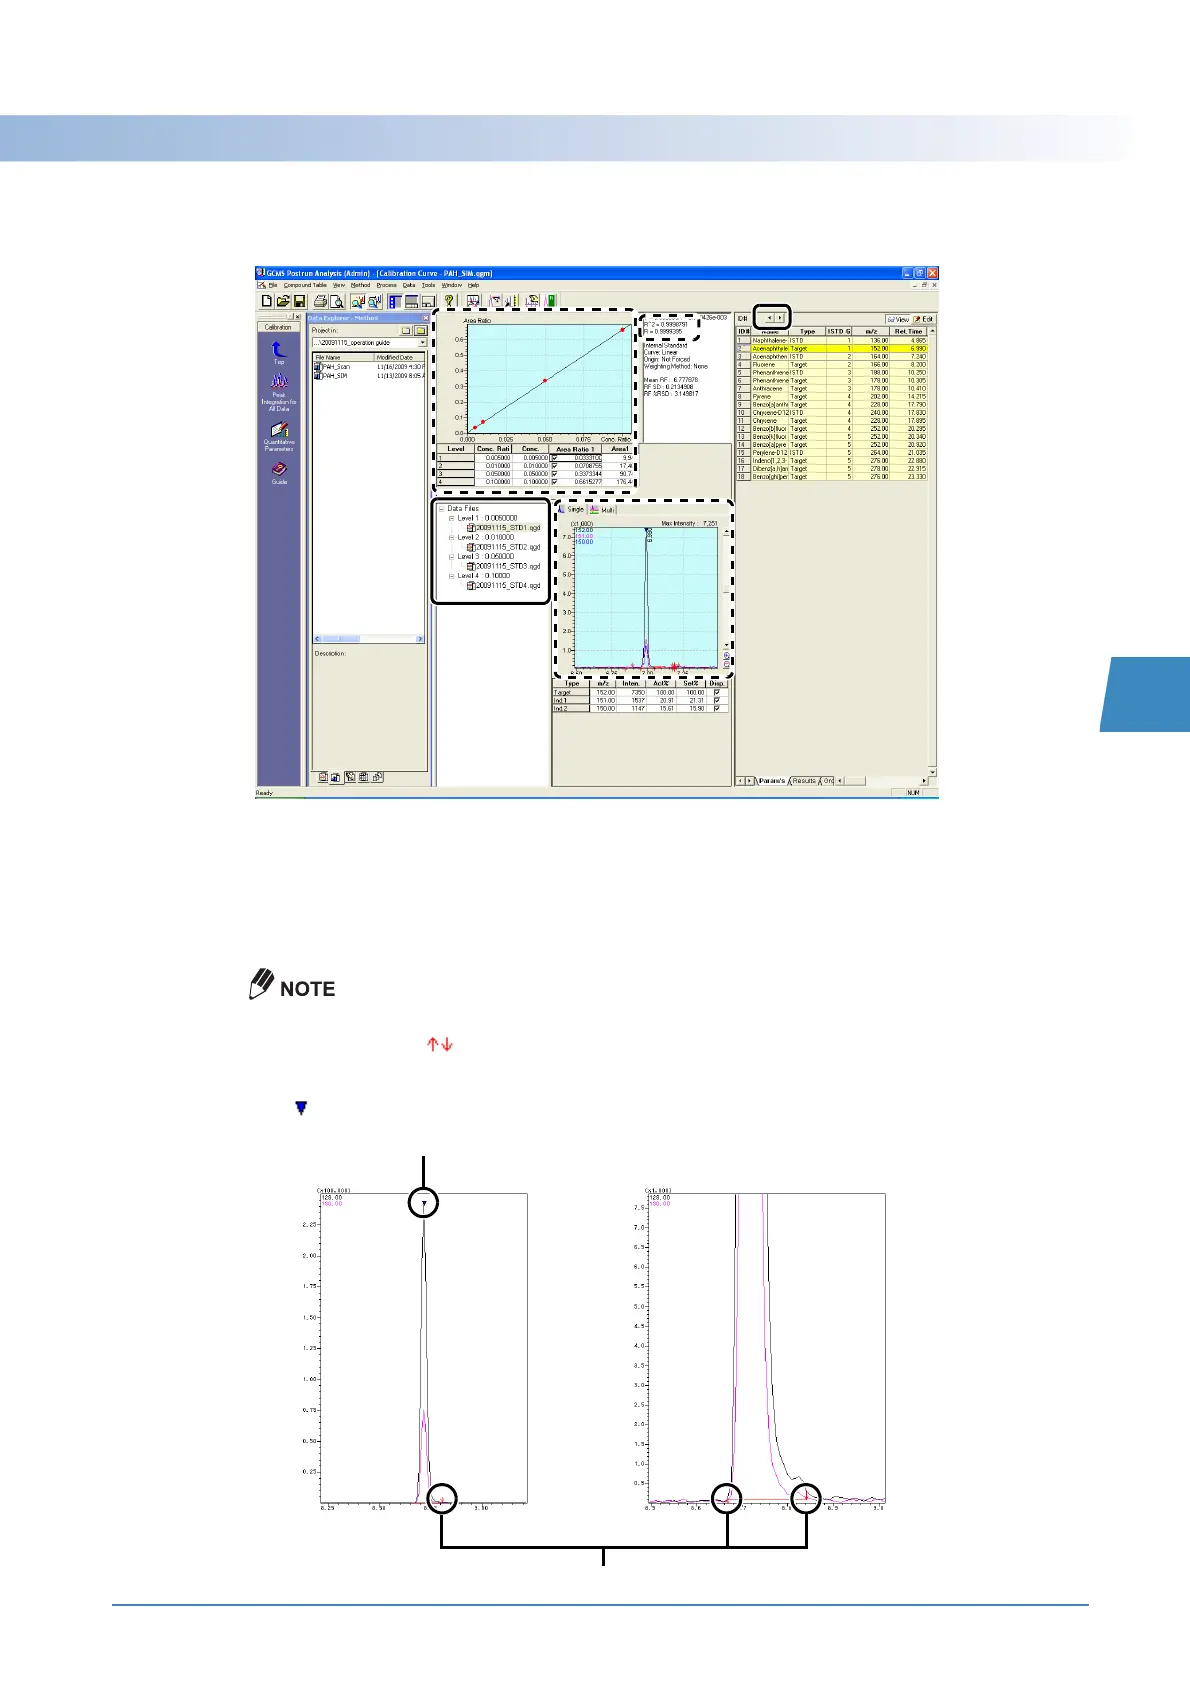
Select a compound in the compound table and click the calibration curve level.
Check the calibration curve created and the chromatogram.
^ Reference
If no peaks are identified or detected, perform identification or peak integration with reference to
"Manual Identification and Manual Peak Integration" P.63.
To change the method used to plot calibration curves, see "Changing Parameters for Quantitative
Processing" P.65.
Peaks that are detected in the chromatograms after automatic peak integration, will have peak
detection marks ( ).
The detected peaks are subjected to identification based on the retention times and ion ratios
( peak identification mark).
Peak identification mark
Peak detection marks

 Loading...